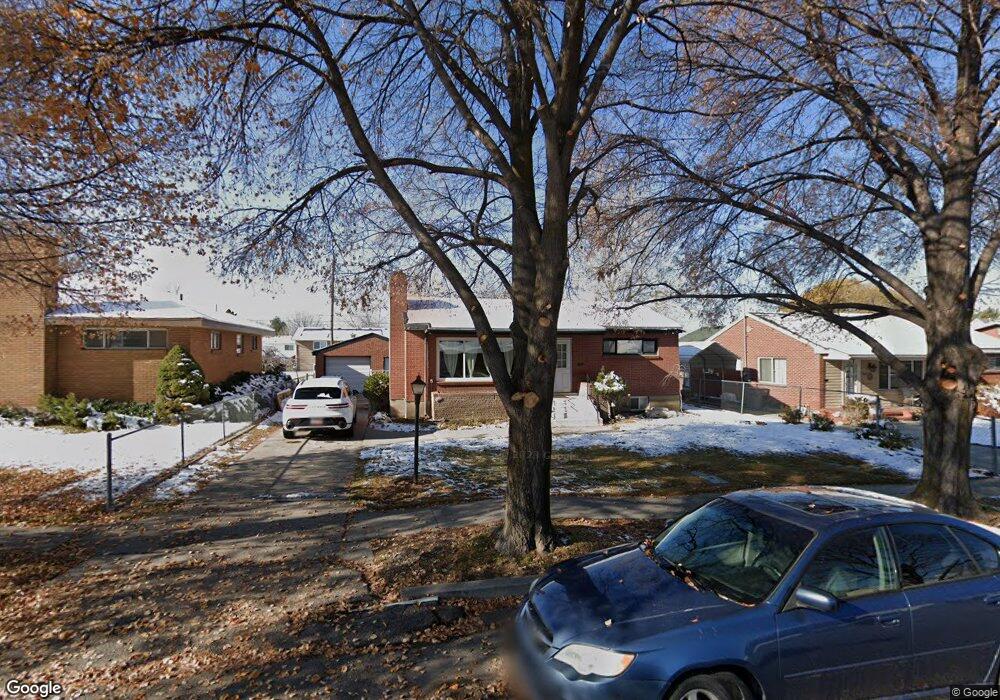
383 N 400 W American Fork, UT 84003
Estimated Value: $436,000 - $460,000
2
Beds
2
Baths
936
Sq Ft
$474/Sq Ft
Est. Value
About This Home
This home is located at 383 N 400 W, American Fork, UT 84003 and is currently estimated at $443,378, approximately $473 per square foot. 383 N 400 W is a home located in Utah County with nearby schools including Shelley Elementary School, American Fork Junior High School, and American Fork High School.
Ownership History
Date
Name
Owned For
Owner Type
Purchase Details
Closed on
Aug 25, 2017
Sold by
Roberts John Scott and Roberts Nanci
Bought by
Roberts Nanci and Roberts John Scott
Current Estimated Value
Home Financials for this Owner
Home Financials are based on the most recent Mortgage that was taken out on this home.
Original Mortgage
$40,000
Outstanding Balance
$33,457
Interest Rate
3.96%
Estimated Equity
$409,921
Purchase Details
Closed on
Sep 8, 2016
Sold by
Cornell Carma
Bought by
Roberts John Scott and Roberts Nanci
Home Financials for this Owner
Home Financials are based on the most recent Mortgage that was taken out on this home.
Original Mortgage
$152,000
Interest Rate
3.48%
Create a Home Valuation Report for This Property
The Home Valuation Report is an in-depth analysis detailing your home's value as well as a comparison with similar homes in the area
Home Values in the Area
Average Home Value in this Area
Purchase History
| Date | Buyer | Sale Price | Title Company |
|---|---|---|---|
| Roberts Nanci | -- | American Secure Title Tremon | |
| Roberts John Scott | -- | Backman Title Services Ltd |
Source: Public Records
Mortgage History
| Date | Status | Borrower | Loan Amount |
|---|---|---|---|
| Open | Roberts Nanci | $40,000 | |
| Previous Owner | Roberts John Scott | $152,000 |
Source: Public Records
Tax History Compared to Growth
Tax History
| Year | Tax Paid | Tax Assessment Tax Assessment Total Assessment is a certain percentage of the fair market value that is determined by local assessors to be the total taxable value of land and additions on the property. | Land | Improvement |
|---|---|---|---|---|
| 2025 | $1,866 | $220,440 | $179,900 | $220,900 |
| 2024 | $1,866 | $207,295 | $0 | $0 |
| 2023 | $1,771 | $208,670 | $0 | $0 |
| 2022 | $1,790 | $208,065 | $0 | $0 |
| 2021 | $1,529 | $277,700 | $129,100 | $148,600 |
| 2020 | $1,429 | $251,600 | $115,300 | $136,300 |
| 2019 | $1,291 | $235,100 | $98,800 | $136,300 |
| 2018 | $1,194 | $207,900 | $88,900 | $119,000 |
| 2017 | $1,172 | $110,165 | $0 | $0 |
| 2016 | $1,112 | $97,130 | $0 | $0 |
| 2015 | $1,114 | $92,290 | $0 | $0 |
| 2014 | $1,093 | $89,375 | $0 | $0 |
Source: Public Records
Map
Nearby Homes
- 356 N 480 W
- 370 W Pacific Dr Unit 1
- 399 W Pacific Dr
- 540 N 300 W
- 641 N 420 W
- 365 N 100 W
- 120 N 350 W Unit 127
- 120 N 350 W Unit 133
- 120 N 350 W Unit 130
- 129 W Pacific Dr
- 621 N 100 W
- 105 N 100 W
- 217 W Main St
- 374 N Center St
- 777 W State Rd
- 782 N 200 W
- 796 N 200 W
- 55 Roosevelt Ave
- 351 Washington Ave
- 82 S Lincoln Ave