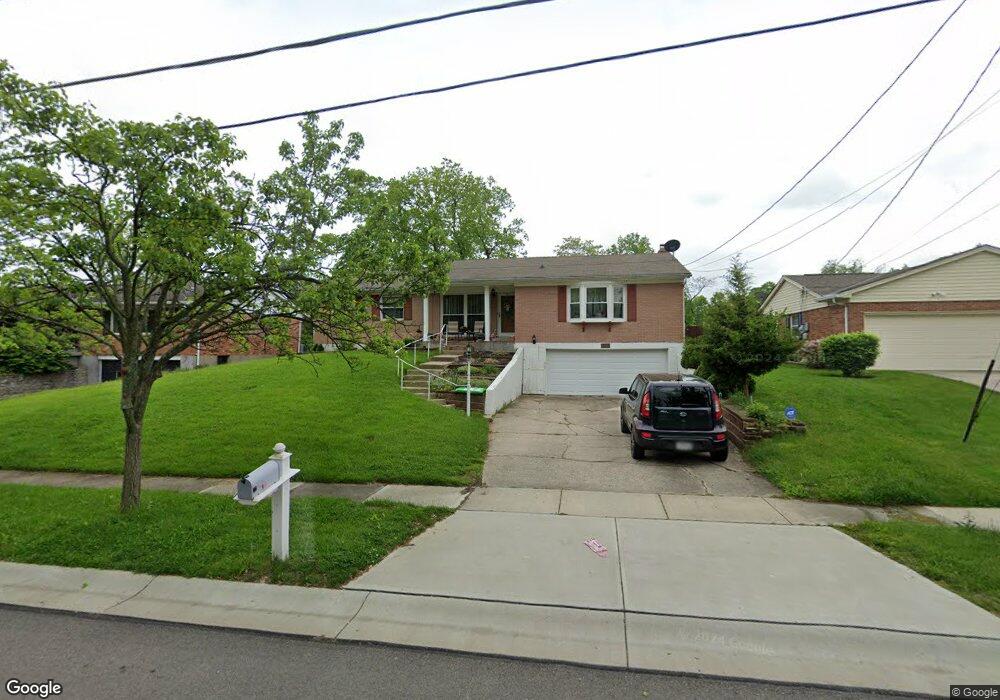
383 Naylor Ct Cincinnati, OH 45246
Estimated Value: $281,000 - $339,604
About This Home
This home is located at 383 Naylor Ct, Cincinnati, OH 45246 and is currently estimated at $323,151, approximately $181 per square foot. 383 Naylor Ct is a home located in Hamilton County with nearby schools including Springdale Elementary School, Princeton Community Middle School, and Princeton High School.
Ownership History
We collect this data history from publicly available records. To have your information removed, we recommend requesting removal directly through your county’s website.
Purchase Details
Home Financials for this Owner
Home Financials are based on the most recent Mortgage that was taken out on this home.Purchase Details
Home Values in the Area
Average Home Value in this Area
Purchase History
We collect this data history from publicly available records. To have your information removed, we recommend requesting removal directly through your county’s website.
| Date | Buyer | Sale Price | Title Company |
|---|---|---|---|
| $153,000 | Chicago Title Insurance Comp | ||
| -- | -- |
Mortgage History
We collect this data history from publicly available records. To have your information removed, we recommend requesting removal directly through your county’s website.
| Date | Status | Borrower | Loan Amount |
|---|---|---|---|
| Open | $145,350 |
Tax History
We collect this data history from publicly available records. To have your information removed, we recommend requesting removal directly through your county’s website.
| Year | Tax Paid | Tax Assessment Tax Assessment Total Assessment is a certain percentage of the fair market value that is determined by local assessors to be the total taxable value of land and additions on the property. | Land | Improvement |
|---|---|---|---|---|
| 2025 | $5,087 | $101,277 | $13,885 | $87,392 |
| 2023 | $4,384 | $101,277 | $13,885 | $87,392 |
| 2022 | $3,802 | $71,418 | $13,538 | $57,880 |
| 2021 | $3,702 | $71,418 | $13,538 | $57,880 |
| 2020 | $3,742 | $71,418 | $13,538 | $57,880 |
| 2019 | $3,464 | $61,040 | $11,571 | $49,469 |
| 2018 | $4,289 | $61,040 | $11,571 | $49,469 |
| 2017 | $3,064 | $61,040 | $11,571 | $49,469 |
| 2016 | $2,960 | $58,503 | $10,878 | $47,625 |
| 2015 | $2,986 | $58,503 | $10,878 | $47,625 |
| 2014 | $2,996 | $58,503 | $10,878 | $47,625 |
| 2013 | $3,117 | $62,237 | $11,571 | $50,666 |
Map
- 163 Washington Ave
- 1120 Jefferson Ave
- 11570 Rose Ln
- 217 Droxford Ct
- 11615 Maxey Ln
- 468 Dorothy Ln
- 531 W Kemper Rd
- 602 Brightview Place Unit 34
- 103 W Sharon Rd
- 612 Brightview Place Unit 30
- 614 Brightview Place Unit 29
- 620 Brightview Place Unit 27
- 622 Brightview Place Unit 26
- 10833 Blackburn Ct Unit 35
- 10831 Blackburn Ct
- 10833 Blackburn Ct
- 10829 Blackburn Ct
- 10827 Blackburn Ct Unit 38
- 10831 Blackburn Ct Unit 36
- 10829 Blackburn Ct Unit 37
Ask me questions while you tour the home.