Estimated Value: $220,154
2
Beds
2
Baths
2,176
Sq Ft
$101/Sq Ft
Est. Value
About This Home
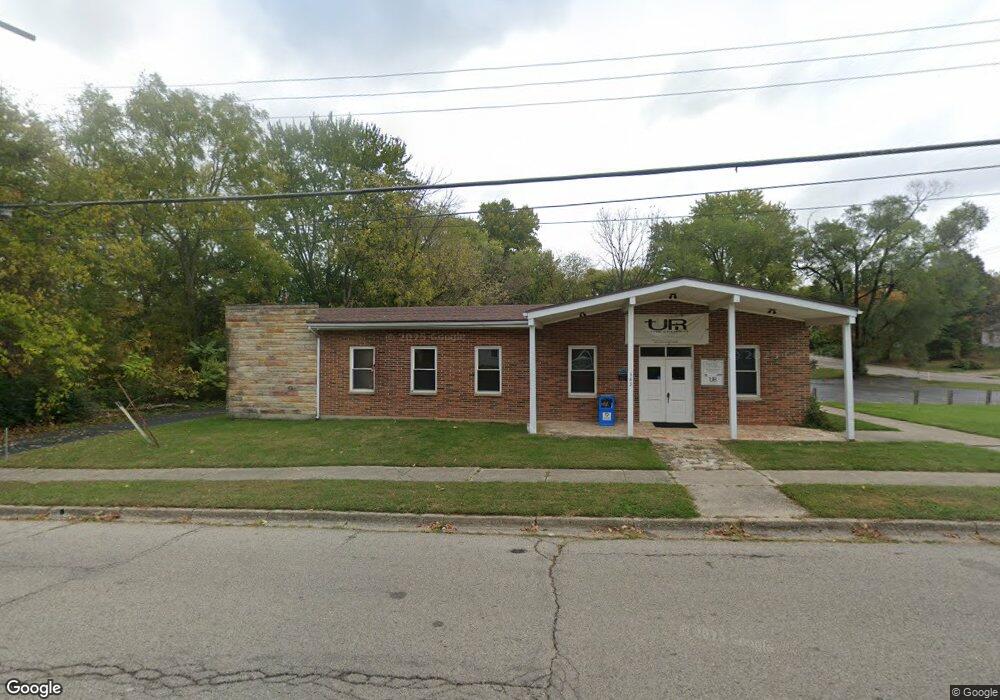
This home is located at 383 S Columbus St, Xenia, OH 45385 and is currently estimated at $220,154, approximately $101 per square foot. 383 S Columbus St is a home located in Greene County with nearby schools including Xenia High School, Summit Academy Community School for Alternative Learners - Xenia, and Legacy Christian Academy.
Ownership History
Date
Name
Owned For
Owner Type
Purchase Details
Closed on
Jan 24, 2007
Sold by
Hutchinson Randall and Hutchinson Callie
Bought by
Webb Freddie M and Webb Tricia L
Current Estimated Value
Home Financials for this Owner
Home Financials are based on the most recent Mortgage that was taken out on this home.
Original Mortgage
$47,000
Interest Rate
6.19%
Mortgage Type
Commercial
Purchase Details
Closed on
Oct 5, 2001
Sold by
Grace Bible Fellowship Inc
Bought by
Hutchinson Randall
Create a Home Valuation Report for This Property
The Home Valuation Report is an in-depth analysis detailing your home's value as well as a comparison with similar homes in the area
Home Values in the Area
Average Home Value in this Area
Purchase History
| Date | Buyer | Sale Price | Title Company |
|---|---|---|---|
| Webb Freddie M | $125,000 | Attorney | |
| Hutchinson Randall | $98,500 | -- |
Source: Public Records
Mortgage History
| Date | Status | Borrower | Loan Amount |
|---|---|---|---|
| Previous Owner | Webb Freddie M | $47,000 |
Source: Public Records
Tax History Compared to Growth
Tax History
| Year | Tax Paid | Tax Assessment Tax Assessment Total Assessment is a certain percentage of the fair market value that is determined by local assessors to be the total taxable value of land and additions on the property. | Land | Improvement |
|---|---|---|---|---|
| 2024 | -- | $46,930 | $18,540 | $28,390 |
| 2023 | $0 | $46,930 | $18,540 | $28,390 |
| 2022 | $0 | $44,850 | $18,540 | $26,310 |
| 2021 | $0 | $44,850 | $18,540 | $26,310 |
| 2020 | $0 | $44,850 | $18,540 | $26,310 |
| 2019 | $0 | $41,020 | $15,450 | $25,570 |
| 2018 | $0 | $41,020 | $15,450 | $25,570 |
| 2017 | $0 | $41,020 | $15,450 | $25,570 |
| 2016 | $0 | $41,450 | $15,450 | $26,000 |
| 2015 | -- | $41,450 | $15,450 | $26,000 |
| 2014 | -- | $41,450 | $15,450 | $26,000 |
Source: Public Records
Map
Nearby Homes