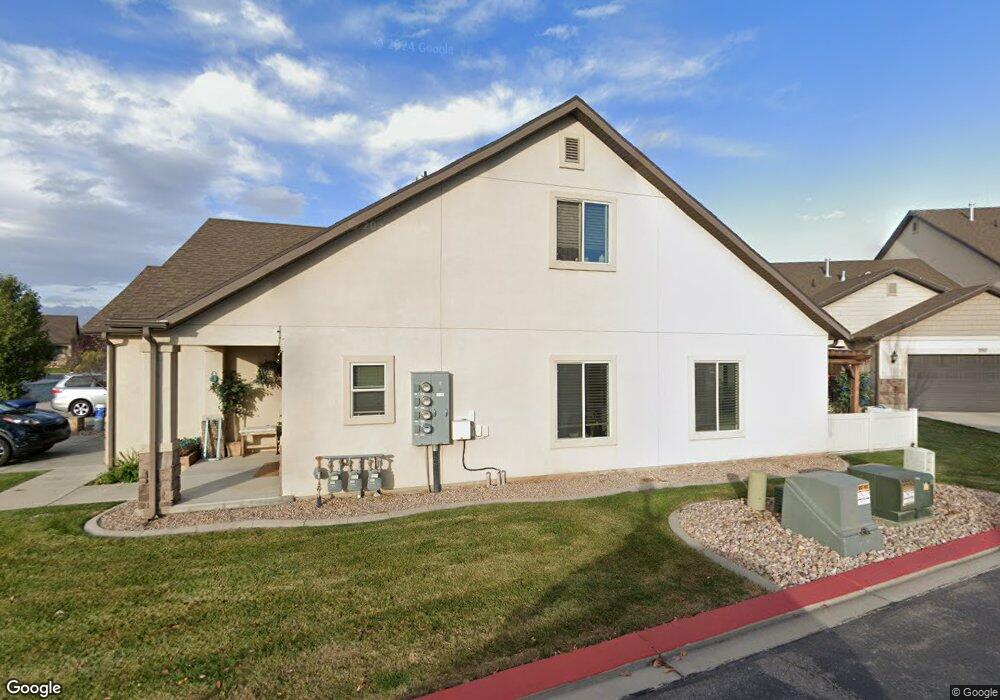
383 Spanish Trails Blvd Spanish Fork, UT 84660
Estimated Value: $367,000 - $404,000
3
Beds
3
Baths
1,762
Sq Ft
$223/Sq Ft
Est. Value
About This Home
This home is located at 383 Spanish Trails Blvd, Spanish Fork, UT 84660 and is currently estimated at $392,256, approximately $222 per square foot. 383 Spanish Trails Blvd is a home located in Utah County with nearby schools including Riverview Elementary School, Spanish Fork Jr High School, and Spanish Fork High School.
Ownership History
Date
Name
Owned For
Owner Type
Purchase Details
Closed on
Aug 1, 2014
Sold by
Jensen Grayson C and Jensen Shannon Ogden
Bought by
Nelson Bryce Max and Nelson Ashlee Belliston
Current Estimated Value
Home Financials for this Owner
Home Financials are based on the most recent Mortgage that was taken out on this home.
Original Mortgage
$156,750
Outstanding Balance
$119,611
Interest Rate
4.13%
Mortgage Type
New Conventional
Estimated Equity
$272,645
Purchase Details
Closed on
Sep 29, 2009
Sold by
Trans Terra Financial West Inc
Bought by
Jensen Grayson C and Jensen Shannon Ogden
Home Financials for this Owner
Home Financials are based on the most recent Mortgage that was taken out on this home.
Original Mortgage
$151,701
Interest Rate
5.14%
Mortgage Type
FHA
Create a Home Valuation Report for This Property
The Home Valuation Report is an in-depth analysis detailing your home's value as well as a comparison with similar homes in the area
Home Values in the Area
Average Home Value in this Area
Purchase History
| Date | Buyer | Sale Price | Title Company |
|---|---|---|---|
| Nelson Bryce Max | -- | Gt Title Services | |
| Jensen Grayson C | -- | Backman Title Services Ltd |
Source: Public Records
Mortgage History
| Date | Status | Borrower | Loan Amount |
|---|---|---|---|
| Open | Nelson Bryce Max | $156,750 | |
| Previous Owner | Jensen Grayson C | $151,701 |
Source: Public Records
Tax History Compared to Growth
Tax History
| Year | Tax Paid | Tax Assessment Tax Assessment Total Assessment is a certain percentage of the fair market value that is determined by local assessors to be the total taxable value of land and additions on the property. | Land | Improvement |
|---|---|---|---|---|
| 2025 | $1,967 | $201,520 | $53,900 | $312,500 |
| 2024 | $1,967 | $202,785 | $0 | $0 |
| 2023 | $1,936 | $199,815 | $0 | $0 |
| 2022 | $2,135 | $216,095 | $0 | $0 |
| 2021 | $1,825 | $295,400 | $44,300 | $251,100 |
| 2020 | $1,705 | $268,400 | $40,300 | $228,100 |
| 2019 | $1,442 | $238,800 | $31,000 | $207,800 |
| 2018 | $1,338 | $214,200 | $26,000 | $188,200 |
| 2017 | $1,212 | $104,280 | $0 | $0 |
| 2016 | $1,127 | $95,700 | $0 | $0 |
| 2015 | $1,069 | $89,650 | $0 | $0 |
| 2014 | $941 | $79,200 | $0 | $0 |
Source: Public Records
Map
Nearby Homes
- 379 Spanish Trails Blvd
- 379 Spanish Trails Blvd Unit 3
- 379 Spanish Trails Blvd Unit ST03A
- 373 Spanish Trails Blvd Unit 2
- 373 Spanish Trails Blvd
- 397 S 340 W Unit 5
- 397 S 340 W
- 369 Spanish Trails Blvd
- 399 S 340 W Unit 6
- 399 S 340 W
- 411 S Spanish Trails Blvd Unit 55
- 403 S 340 W Unit 7
- 403 S 340 W
- 415 S Spanish Trails Blvd Unit LOT 56
- 409 S 340 W Unit 8
- 409 S 340 W
- 416 S 340 W Unit 25
- 416 S 340 W
- 419 S Spanish Trails Blvd Unit LOT 57
- 413 S 340 W Unit 9