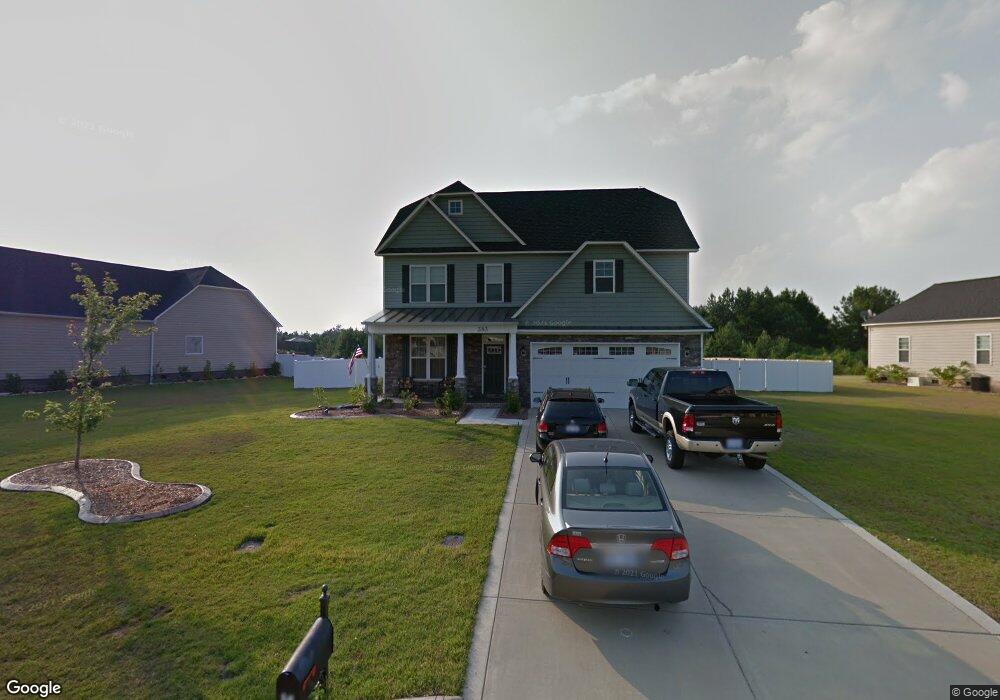
383 St Johns Loop Raeford, NC 28376
Estimated Value: $363,000 - $415,000
3
Beds
4
Baths
3,013
Sq Ft
$132/Sq Ft
Est. Value
About This Home
This home is located at 383 St Johns Loop, Raeford, NC 28376 and is currently estimated at $396,958, approximately $131 per square foot. 383 St Johns Loop is a home located in Hoke County with nearby schools including Rockfish Hoke Elementary School, East Hoke Middle, and Hoke County High.
Ownership History
Date
Name
Owned For
Owner Type
Purchase Details
Closed on
Jan 20, 2011
Sold by
H & H Homes Of Fayetteville Llc
Bought by
Riley Derek and Riley Gina
Current Estimated Value
Home Financials for this Owner
Home Financials are based on the most recent Mortgage that was taken out on this home.
Original Mortgage
$263,415
Outstanding Balance
$177,862
Interest Rate
4.58%
Mortgage Type
VA
Estimated Equity
$219,096
Create a Home Valuation Report for This Property
The Home Valuation Report is an in-depth analysis detailing your home's value as well as a comparison with similar homes in the area
Home Values in the Area
Average Home Value in this Area
Purchase History
| Date | Buyer | Sale Price | Title Company |
|---|---|---|---|
| Riley Derek | $255,000 | -- | |
| Riley Derek | $255,000 | -- |
Source: Public Records
Mortgage History
| Date | Status | Borrower | Loan Amount |
|---|---|---|---|
| Open | Riley Derek | $263,415 |
Source: Public Records
Tax History
| Year | Tax Paid | Tax Assessment Tax Assessment Total Assessment is a certain percentage of the fair market value that is determined by local assessors to be the total taxable value of land and additions on the property. | Land | Improvement |
|---|---|---|---|---|
| 2025 | $2,562 | $300,200 | $22,000 | $278,200 |
| 2024 | $2,562 | $300,200 | $22,000 | $278,200 |
| 2023 | $2,562 | $300,200 | $22,000 | $278,200 |
| 2022 | $2,513 | $300,200 | $22,000 | $278,200 |
| 2021 | $2,797 | $327,900 | $22,000 | $305,900 |
| 2020 | $2,850 | $327,900 | $22,000 | $305,900 |
| 2019 | $2,850 | $327,900 | $22,000 | $305,900 |
| 2018 | $2,850 | $327,900 | $22,000 | $305,900 |
| 2017 | $2,850 | $327,900 | $22,000 | $305,900 |
| 2016 | $2,795 | $327,900 | $22,000 | $305,900 |
| 2015 | $2,795 | $327,900 | $22,000 | $305,900 |
| 2014 | $2,543 | $300,420 | $22,000 | $278,420 |
| 2013 | -- | $279,390 | $33,000 | $246,390 |
Source: Public Records
Map
Nearby Homes
- 169 Eclipse Ct
- 172 Collinwood Dr
- 667 Saint Johns Loop
- 286 Sedgefield Dr
- 202 Ivy Stone Dr
- 1486 Saint Johns Loop
- 573 Thorncliff Dr
- 505 Collinwood Dr
- 151 Ivy Stone Dr
- 258 Lennox Loop
- 188 Stockbridge Dr
- 219 Stockbridge Dr
- 168 Bennington Dr
- 601 Collinwood Dr
- 151 Huntington Dr
- 131 Emerywood Ct
- 1093 Saint Johns Loop
- 208 Lochwood Dr
- 196 Lochwood Dr
- 273 Saint George Dr
- 383 Saint Johns Loop
- 357 St John's Loop
- 357 St Johns Loop
- 357 Saint Johns Loop
- 409 Saint Johns Loop
- 409 St Johns Loop
- 335 Saint Johns Loop
- 335 St Johns Loop
- 437 Saint Johns Loop
- 437 St Johns Loop
- 378 Saint Johns Loop
- 378 St Johns Loop
- 585 Windover Dr
- 241 Snipe Ct
- 366 Saint Johns Loop
- 366 St Johns Loop
- 366 John St
- 231 Snipe Ct
- 241 241 Snipe Ct
- 346 St Johns Loop
Your Personal Tour Guide
Ask me questions while you tour the home.