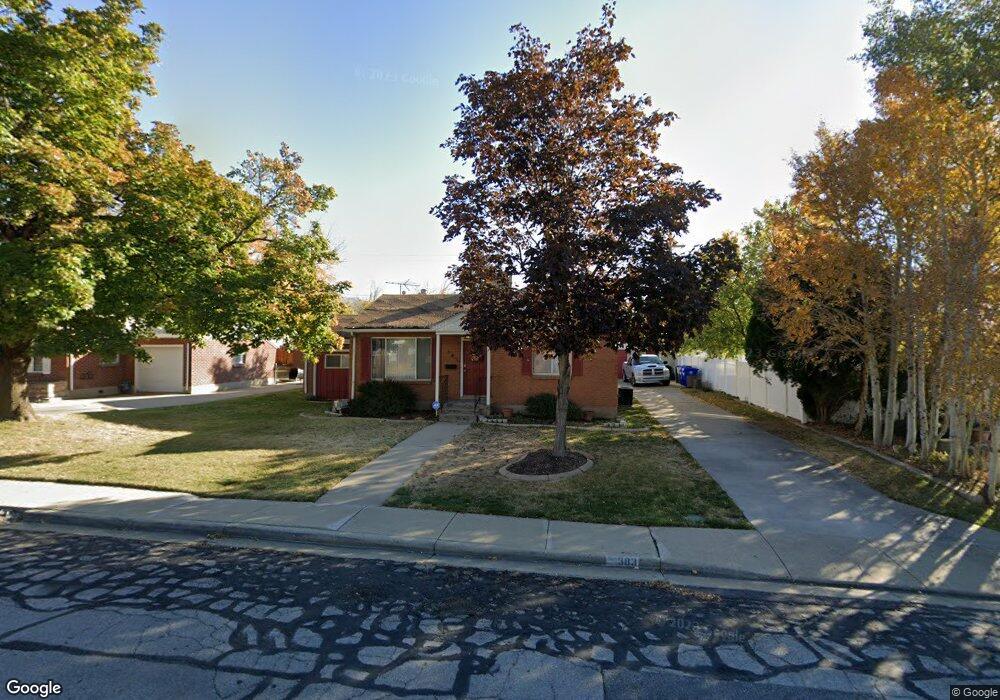
383 W 325 S Bountiful, UT 84010
Estimated Value: $338,000 - $416,000
2
Beds
1
Bath
1,041
Sq Ft
$370/Sq Ft
Est. Value
About This Home
This home is located at 383 W 325 S, Bountiful, UT 84010 and is currently estimated at $385,112, approximately $369 per square foot. 383 W 325 S is a home located in Davis County with nearby schools including Meadowbrook Elementary School, Bountiful Junior High School, and Bountiful High School.
Ownership History
Date
Name
Owned For
Owner Type
Purchase Details
Closed on
Oct 6, 2005
Sold by
Jensen Dixie Lee
Bought by
Hilton John Michael
Current Estimated Value
Purchase Details
Closed on
Jun 8, 2001
Sold by
Jensen Dixie L
Bought by
Jensen Dixie Lee
Purchase Details
Closed on
Jun 2, 1998
Sold by
Browning Milon Jan
Bought by
Jensen Dixie L
Home Financials for this Owner
Home Financials are based on the most recent Mortgage that was taken out on this home.
Original Mortgage
$87,900
Interest Rate
7.1%
Purchase Details
Closed on
Aug 27, 1997
Sold by
Jeppson Christopher and Jeppson Tracy D
Bought by
Browning Milon Jan
Home Financials for this Owner
Home Financials are based on the most recent Mortgage that was taken out on this home.
Original Mortgage
$67,000
Interest Rate
7.43%
Mortgage Type
Balloon
Create a Home Valuation Report for This Property
The Home Valuation Report is an in-depth analysis detailing your home's value as well as a comparison with similar homes in the area
Purchase History
| Date | Buyer | Sale Price | Title Company |
|---|---|---|---|
| Hilton John Michael | -- | Bonneville Title Company | |
| Jensen Dixie Lee | -- | -- | |
| Jensen Dixie L | -- | Backman Stewart Title Servic | |
| Browning Milon Jan | -- | Associated Title Company |
Source: Public Records
Mortgage History
| Date | Status | Borrower | Loan Amount |
|---|---|---|---|
| Previous Owner | Jensen Dixie L | $87,900 | |
| Previous Owner | Browning Milon Jan | $67,000 |
Source: Public Records
Tax History
| Year | Tax Paid | Tax Assessment Tax Assessment Total Assessment is a certain percentage of the fair market value that is determined by local assessors to be the total taxable value of land and additions on the property. | Land | Improvement |
|---|---|---|---|---|
| 2025 | $2,257 | $200,750 | $125,443 | $75,307 |
| 2024 | $2,161 | $201,299 | $110,119 | $91,180 |
| 2023 | $2,142 | $199,650 | $112,453 | $87,197 |
| 2022 | $2,139 | $361,000 | $203,910 | $157,090 |
| 2021 | $1,802 | $254,000 | $147,709 | $106,291 |
| 2020 | $1,590 | $224,000 | $126,679 | $97,321 |
| 2019 | $1,605 | $221,000 | $137,246 | $83,754 |
| 2018 | $1,474 | $199,000 | $134,614 | $64,386 |
| 2016 | $1,254 | $91,520 | $54,817 | $36,703 |
| 2015 | $1,283 | $88,715 | $54,817 | $33,898 |
| 2014 | $1,281 | $91,475 | $54,817 | $36,658 |
| 2013 | -- | $86,412 | $36,190 | $50,222 |
Source: Public Records
Map
Nearby Homes
- 376 W 800 S
- 360 W 800 S
- 75 N Peregrine Ln W Unit 8
- 34 W 400 S
- 32 W 400 S
- 990 S 500 W
- 650 S Main St Unit 9106
- 1016 S 400 W
- 290 N 500 W Unit 305
- 399 W 400 N Unit 47
- 332 N 300 W
- 109 W 900 S
- 401 W 400 N Unit 49
- 320 N 200 W Unit 4
- 545 S 100 E
- 254 N Main St
- 252 N Main St
- 256 N Main St
- 51 E 200 N Unit 3
- 55 E 200 N Unit 2
Your Personal Tour Guide
Ask me questions while you tour the home.