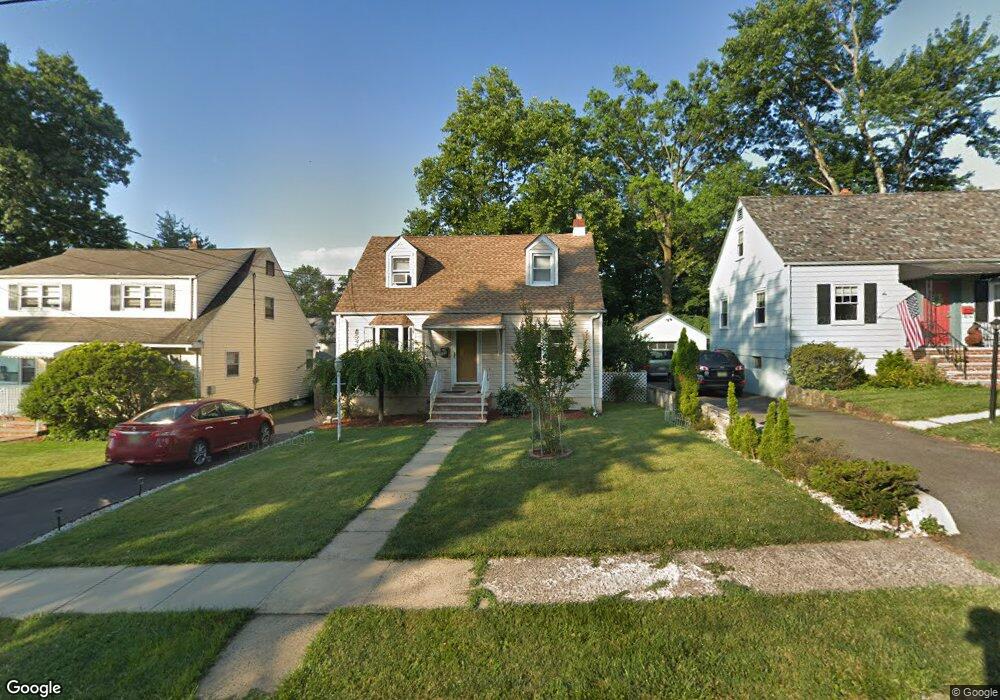
383 Windsor St Unit 5 North Plainfield, NJ 07060
Estimated Value: $474,000 - $501,989
--
Bed
--
Bath
1,170
Sq Ft
$416/Sq Ft
Est. Value
About This Home
This home is located at 383 Windsor St Unit 5, North Plainfield, NJ 07060 and is currently estimated at $486,247, approximately $415 per square foot. 383 Windsor St Unit 5 is a home located in Somerset County with nearby schools including Somerset Intermediate School, North Plainfield Middle/High School, and North Plainfield Middle School.
Ownership History
Date
Name
Owned For
Owner Type
Purchase Details
Closed on
Apr 14, 2021
Sold by
Ahundiz Ann Silvia
Bought by
Maisanche Luis G Lozada and Peralta Fanny M
Current Estimated Value
Home Financials for this Owner
Home Financials are based on the most recent Mortgage that was taken out on this home.
Original Mortgage
$366,244
Outstanding Balance
$331,202
Interest Rate
3.1%
Mortgage Type
FHA
Estimated Equity
$155,045
Purchase Details
Closed on
Jan 16, 2006
Sold by
Abundiz Juan J
Bought by
Abundiz Anna Silvia
Purchase Details
Closed on
Aug 31, 2000
Sold by
Lombardi Philip
Bought by
Silva Abundiz and Abundiz Juan
Home Financials for this Owner
Home Financials are based on the most recent Mortgage that was taken out on this home.
Original Mortgage
$114,500
Interest Rate
8.1%
Create a Home Valuation Report for This Property
The Home Valuation Report is an in-depth analysis detailing your home's value as well as a comparison with similar homes in the area
Home Values in the Area
Average Home Value in this Area
Purchase History
| Date | Buyer | Sale Price | Title Company |
|---|---|---|---|
| Maisanche Luis G Lozada | $373,000 | Old Republic Title | |
| Abundiz Anna Silvia | -- | None Available | |
| Silva Abundiz | $118,000 | -- |
Source: Public Records
Mortgage History
| Date | Status | Borrower | Loan Amount |
|---|---|---|---|
| Open | Maisanche Luis G Lozada | $366,244 | |
| Previous Owner | Silva Abundiz | $114,500 |
Source: Public Records
Tax History Compared to Growth
Tax History
| Year | Tax Paid | Tax Assessment Tax Assessment Total Assessment is a certain percentage of the fair market value that is determined by local assessors to be the total taxable value of land and additions on the property. | Land | Improvement |
|---|---|---|---|---|
| 2025 | $9,152 | $210,000 | $80,000 | $130,000 |
| 2024 | $9,152 | $210,000 | $80,000 | $130,000 |
| 2023 | $8,923 | $210,000 | $80,000 | $130,000 |
| 2022 | $8,570 | $210,000 | $80,000 | $130,000 |
| 2021 | $8,057 | $210,000 | $80,000 | $130,000 |
| 2020 | $8,215 | $210,000 | $80,000 | $130,000 |
| 2019 | $7,997 | $210,000 | $80,000 | $130,000 |
| 2018 | $7,827 | $210,000 | $80,000 | $130,000 |
| 2017 | $7,928 | $210,000 | $80,000 | $130,000 |
| 2016 | $7,537 | $210,000 | $80,000 | $130,000 |
| 2015 | $8,362 | $243,300 | $111,500 | $131,800 |
| 2014 | $7,978 | $243,300 | $111,500 | $131,800 |
Source: Public Records
Map
Nearby Homes
- 380 Watchung Ave Unit 82
- 368 Harold St
- 610 Somerset St
- 277 Watchung Ave
- 401 U S 22 Unit C
- 401 U S 22 Unit A
- 401 U S 22 Unit E
- 401 U S 22 Unit G
- 401 U S 22 Unit F
- 758 Somerset St Unit 2
- 183 Johnston Dr
- 401 US Highway 22 Unit B
- 401 US Highway 22 Unit D
- 401 US Highway 22 Unit 42G
- 240 Belmont Ave
- 163 Delacy Ave
- 401 Route 22 Unit 11G
- 301 Duer St
- 401 Us Highway Rt 22 U 26h Unit H
- 153 Westervelt Ave