
D
Seller's Agent in 2026
Dane Fuglestad
REALTY XPERTS
(701) 361-6135
7 in this area
162 Total Sales
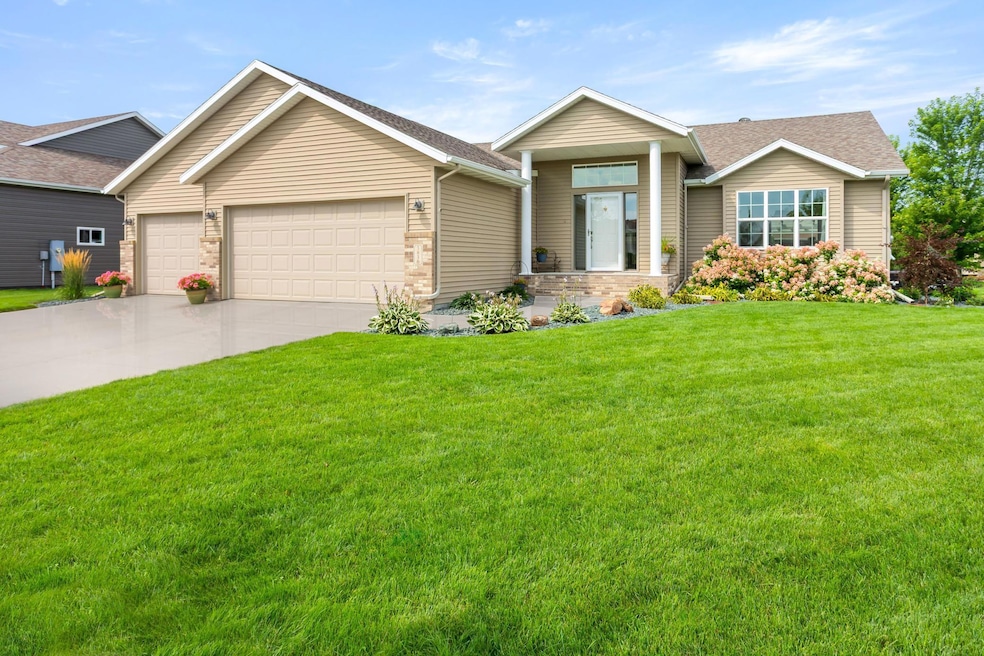
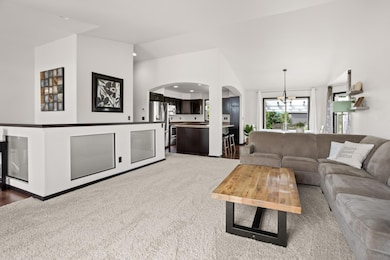
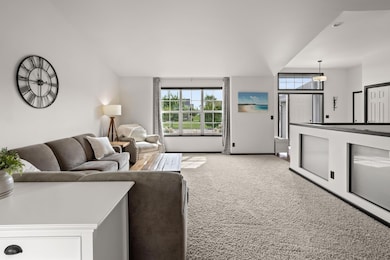

Check out this beautiful rambler-style home featuring 5 bedrooms and 3 bathrooms, located in the highly coveted neighborhood of The Reserve at Osgood in West Fargo, ND. This one-owner home offers over 3,100 sq. ft. of living space and includes a stunning patio with a maintenance-free pergola.
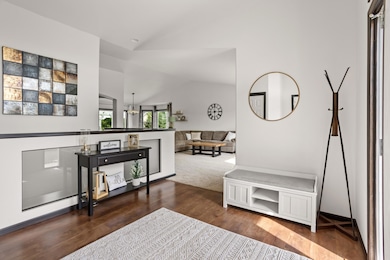
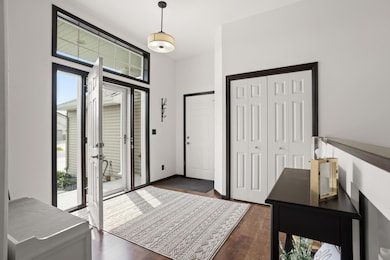
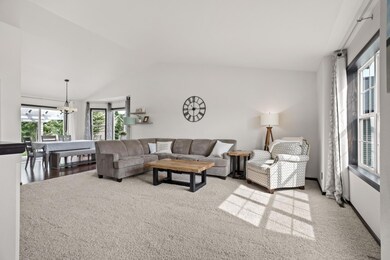
You’ll love the professionally landscaped yard, complete with a sprinkler system and well-maintained lawn. Inside, the home boasts an open layout and has been meticulously cared for. Additional features include surround sound in the basement, main-floor laundry, and much more.
Contact your favorite Realtor today to schedule a private showing!
| Date | Type | Sale Price | Title Company |
|---|---|---|---|
| Warranty Deed | $589,900 | None Listed On Document | |
| Warranty Deed | $275,512 | None Available | |
| Warranty Deed | -- | None Available |
| Date | Status | Loan Amount | Loan Type |
|---|---|---|---|
| Open | $501,415 | New Conventional | |
| Previous Owner | $264,353 | FHA |
| Date | Event | Price | List to Sale | Price per Sq Ft |
|---|---|---|---|---|
| 02/05/2026 02/05/26 | Sold | -- | -- | -- |
| 12/20/2025 12/20/25 | Pending | -- | -- | -- |
| 10/16/2025 10/16/25 | For Sale | $589,900 | -- | $191 / Sq Ft |
| Year | Tax Paid | Tax Assessment Tax Assessment Total Assessment is a certain percentage of the fair market value that is determined by local assessors to be the total taxable value of land and additions on the property. | Land | Improvement |
|---|---|---|---|---|
| 2024 | $6,649 | $229,400 | $42,500 | $186,900 |
| 2023 | $6,770 | $213,900 | $42,500 | $171,400 |
| 2022 | $6,499 | $199,700 | $42,500 | $157,200 |
| 2021 | $6,147 | $183,850 | $34,000 | $149,850 |
| 2020 | $6,022 | $182,650 | $34,000 | $148,650 |
| 2019 | $6,047 | $181,250 | $34,000 | $147,250 |
| 2018 | $5,995 | $184,300 | $34,000 | $150,300 |
| 2017 | $5,810 | $184,300 | $34,000 | $150,300 |
| 2016 | $5,142 | $184,000 | $34,000 | $150,000 |
| 2015 | $4,235 | $147,300 | $24,700 | $122,600 |
| 2014 | $2,117 | $137,650 | $24,700 | $112,950 |
| 2013 | $2,090 | $62,650 | $24,700 | $37,950 |
D
Seller's Agent in 2026
Dane Fuglestad
REALTY XPERTS
(701) 361-6135
7 in this area
162 Total Sales
B
Buyer's Agent in 2026
Bill Kieffer
RE/MAX Legacy Realty
(701) 306-0373
5 in this area
141 Total Sales
Source: NorthstarMLS
MLS Number: 6805361
APN: 02-5151-00190-000
Disclaimer: Certain information contained herein is derived from information provided by parties other than Homes.com. All information provided is deemed reliable, but is not guaranteed to be accurate and should be independently verified.
![]() Based on information submitted to the MLS GRID. All data is obtained from various sources and may not have been verified by broker or MLS GRID. Supplied Open House Information is subject to change without notice. All information should be independently reviewed and verified for accuracy. Properties may or may not be listed by the office/agent presenting the information. Some IDX listings have been excluded from this website.
Based on information submitted to the MLS GRID. All data is obtained from various sources and may not have been verified by broker or MLS GRID. Supplied Open House Information is subject to change without notice. All information should be independently reviewed and verified for accuracy. Properties may or may not be listed by the office/agent presenting the information. Some IDX listings have been excluded from this website.
The Digital Millennium Copyright Act of 1998, 17 U.S.C. § 512 (the “DMCA”) provides recourse for copyright owners who believe that material appearing on the Internet infringes their rights under U.S. copyright law. If you believe in good faith that any content or material made available in connection with our website or services infringes your copyright, you (or your agent) may send us a notice requesting that the content or material be removed, or access to it blocked.
Notices must be sent in writing by email to DMCAnotice@MLSGrid.com.
The DMCA requires that your notice of alleged copyright infringement include the following information:
(1) description of the copyrighted work that is the subject of claimed infringement;
(2) description of the alleged infringing content and information sufficient to permit us to locate the content;
(3) contact information for you, including your address, telephone number and email address;
(4) a statement by you that you have a good faith belief that the content in the manner complained of is not authorized by the copyright owner, or its agent, or by the operation of any law;
(5) a statement by you, signed under penalty of perjury, that the information in the notification is accurate and that you have the authority to enforce the copyrights that are claimed to be infringed; and
(6) a physical or electronic signature of the copyright owner or a person authorized to act on the copyright owner’s behalf. Failure to include all of the above information may result in the delay of the processing of your complaint.
Ask me questions while you tour the home.