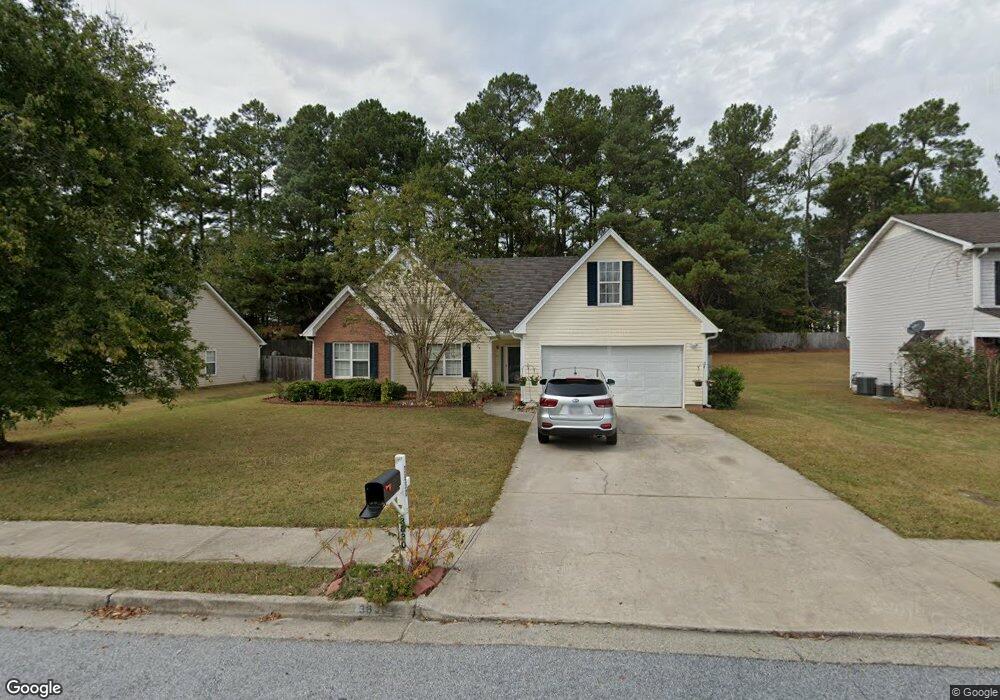
3830 Brushymill Ct Loganville, GA 30052
Estimated Value: $309,000 - $334,000
3
Beds
2
Baths
1,779
Sq Ft
$181/Sq Ft
Est. Value
About This Home
This home is located at 3830 Brushymill Ct, Loganville, GA 30052 and is currently estimated at $321,571, approximately $180 per square foot. 3830 Brushymill Ct is a home located in Gwinnett County with nearby schools including Magill Elementary School, Grace Snell Middle School, and South Gwinnett High School.
Ownership History
Date
Name
Owned For
Owner Type
Purchase Details
Closed on
Oct 12, 2005
Sold by
Smolarsky Kenneth and Smolarsky Abby
Bought by
Alleyne Curtis R and Alleyne Diana
Current Estimated Value
Home Financials for this Owner
Home Financials are based on the most recent Mortgage that was taken out on this home.
Original Mortgage
$147,581
Outstanding Balance
$78,494
Interest Rate
5.66%
Mortgage Type
VA
Estimated Equity
$243,077
Purchase Details
Closed on
Oct 11, 2005
Sold by
Martinovic Oliver
Bought by
Martinovic Oliver and Martinovic Mijana
Home Financials for this Owner
Home Financials are based on the most recent Mortgage that was taken out on this home.
Original Mortgage
$147,581
Outstanding Balance
$78,494
Interest Rate
5.66%
Mortgage Type
VA
Estimated Equity
$243,077
Purchase Details
Closed on
Mar 29, 2002
Sold by
Hms Damascus
Bought by
Smolarsky Kenneth and Smolarsky Abby
Home Financials for this Owner
Home Financials are based on the most recent Mortgage that was taken out on this home.
Original Mortgage
$145,745
Interest Rate
6.8%
Mortgage Type
VA
Create a Home Valuation Report for This Property
The Home Valuation Report is an in-depth analysis detailing your home's value as well as a comparison with similar homes in the area
Home Values in the Area
Average Home Value in this Area
Purchase History
| Date | Buyer | Sale Price | Title Company |
|---|---|---|---|
| Alleyne Curtis R | $149,900 | -- | |
| Martinovic Oliver | -- | -- | |
| Smolarsky Kenneth | $142,200 | -- |
Source: Public Records
Mortgage History
| Date | Status | Borrower | Loan Amount |
|---|---|---|---|
| Open | Alleyne Curtis R | $147,581 | |
| Previous Owner | Smolarsky Kenneth | $145,745 |
Source: Public Records
Tax History Compared to Growth
Tax History
| Year | Tax Paid | Tax Assessment Tax Assessment Total Assessment is a certain percentage of the fair market value that is determined by local assessors to be the total taxable value of land and additions on the property. | Land | Improvement |
|---|---|---|---|---|
| 2024 | $4,546 | $117,200 | $30,000 | $87,200 |
| 2023 | $4,546 | $124,880 | $29,680 | $95,200 |
| 2022 | $4,343 | $112,520 | $20,000 | $92,520 |
| 2021 | $3,414 | $85,200 | $16,000 | $69,200 |
| 2020 | $3,145 | $77,280 | $14,000 | $63,280 |
| 2019 | $2,836 | $71,720 | $12,000 | $59,720 |
| 2018 | $2,729 | $68,680 | $12,000 | $56,680 |
| 2016 | $2,383 | $58,320 | $9,600 | $48,720 |
| 2015 | $1,999 | $46,800 | $8,000 | $38,800 |
| 2014 | $2,008 | $46,800 | $8,000 | $38,800 |
Source: Public Records
Map
Nearby Homes
- 1035 Brushystone Dr
- 452 Crested View Dr
- 4039 Savannah Ridge Ct
- 4069 Savannah Ridge Ct
- 232 Rockingham Dr
- 110 Slate Ridge Ln
- 3765 Brushy Wood Dr
- 1370 Compton Woods Dr
- 654 Weaver Falls Ct
- 1010 Burning Bush Dr Unit 2
- 4085 Hogans Mill Ln
- 3705 Heron Creek Ct
- 3715 Heron Creek Ct
- 1107 Kingston Hill Dr
- 1107 Kingston Hill Dr Unit 52-B
- 3865 Weeping Willow Ln
- 3512 Weaver Falls Ln
- 3820 Brushymill Ct
- 3840 Brushymill Ct
- 0 Brushymill Ct Unit 7517927
- 0 Brushymill Ct Unit 7448015
- 0 Brushymill Ct Unit 7453299
- 0 Brushymill Ct Unit 7406974
- 0 Brushymill Ct Unit 8672194
- 0 Brushymill Ct Unit 8557521
- 0 Brushymill Ct Unit 8401115
- 0 Brushymill Ct Unit 8268965
- 0 Brushymill Ct Unit 8237232
- 0 Brushymill Ct Unit 8182937
- 0 Brushymill Ct Unit 8138349
- 0 Brushymill Ct Unit 8117628
- 0 Brushymill Ct Unit 7563447
- 0 Brushymill Ct Unit 7548494
- 0 Brushymill Ct Unit 8301674
- 0 Brushymill Ct Unit 8073109
- 0 Brushymill Ct Unit 7044434
- 0 Brushymill Ct Unit 3111371