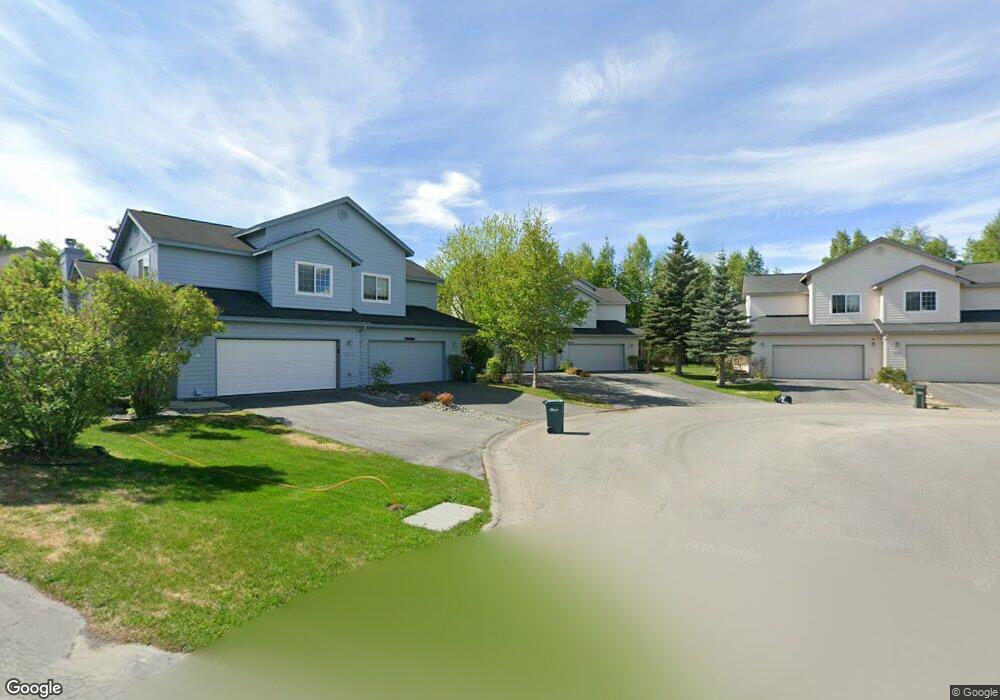
3830 Roald Amundsen Ave Unit 11A Anchorage, AK 99517
Turnagain NeighborhoodEstimated Value: $427,979 - $464,000
3
Beds
3
Baths
1,700
Sq Ft
$262/Sq Ft
Est. Value
About This Home
This home is located at 3830 Roald Amundsen Ave Unit 11A, Anchorage, AK 99517 and is currently estimated at $445,990, approximately $262 per square foot. 3830 Roald Amundsen Ave Unit 11A is a home located in Anchorage Municipality with nearby schools including Lake Hood Elementary School, Romig Middle School, and West High School.
Ownership History
Date
Name
Owned For
Owner Type
Purchase Details
Closed on
Mar 1, 2013
Sold by
Subitch Matthew D
Bought by
Subitch Matthew D and Subitch 2012 Family Trust
Current Estimated Value
Purchase Details
Closed on
Oct 29, 2009
Sold by
Carlson Jenny Brady and Carlson Jeffrey E
Bought by
Subitch Matthew D
Home Financials for this Owner
Home Financials are based on the most recent Mortgage that was taken out on this home.
Original Mortgage
$260,100
Outstanding Balance
$169,835
Interest Rate
5%
Mortgage Type
New Conventional
Estimated Equity
$276,155
Purchase Details
Closed on
Jul 16, 2002
Sold by
Keizer Christopher W and Keizer Alisha L
Bought by
Brady Jenny W
Home Financials for this Owner
Home Financials are based on the most recent Mortgage that was taken out on this home.
Original Mortgage
$139,000
Interest Rate
6.69%
Create a Home Valuation Report for This Property
The Home Valuation Report is an in-depth analysis detailing your home's value as well as a comparison with similar homes in the area
Home Values in the Area
Average Home Value in this Area
Purchase History
| Date | Buyer | Sale Price | Title Company |
|---|---|---|---|
| Subitch Matthew D | -- | None Available | |
| Subitch Matthew D | -- | Atga | |
| Brady Jenny W | -- | -- |
Source: Public Records
Mortgage History
| Date | Status | Borrower | Loan Amount |
|---|---|---|---|
| Open | Subitch Matthew D | $260,100 | |
| Previous Owner | Brady Jenny W | $139,000 |
Source: Public Records
Tax History Compared to Growth
Tax History
| Year | Tax Paid | Tax Assessment Tax Assessment Total Assessment is a certain percentage of the fair market value that is determined by local assessors to be the total taxable value of land and additions on the property. | Land | Improvement |
|---|---|---|---|---|
| 2025 | $5,121 | $418,300 | -- | $418,300 |
| 2024 | $5,121 | $392,200 | $0 | $392,200 |
| 2023 | $4,736 | $353,100 | $0 | $353,100 |
| 2022 | $5,160 | $356,400 | $0 | $356,400 |
| 2021 | $6,001 | $333,000 | $0 | $333,000 |
| 2020 | $4,490 | $314,400 | $0 | $314,400 |
| 2019 | $4,497 | $324,900 | $0 | $324,900 |
| 2018 | $4,549 | $327,400 | $0 | $327,400 |
| 2017 | $4,631 | $315,700 | $0 | $315,700 |
| 2016 | $4,062 | $314,800 | $0 | $314,800 |
| 2015 | $4,062 | $319,200 | $0 | $319,200 |
| 2014 | $4,062 | $306,800 | $0 | $306,800 |
Source: Public Records
Map
Nearby Homes
- 3706 Chaffee Cir
- 3333 Lakeshore Dr Unit 5
- 3333 Lakeshore Dr Unit 2
- 3100 Ward Place Unit 15
- 3430 Wiley Post Loop
- 3900 Crosson Dr
- 3949 Starburst Cir
- 3516 Vintage Cir
- 4041 Woronzof Dr
- 3517 Vintage Cir
- 2831 Bennett Ave
- 3835 Carleton Ave
- 000 Aircraft Dr
- 2925 W 36th Ave
- 2702 Mcrae Rd
- 4302 Forrest Rd
- 3913 Barbara Dr
- 2511 Abbey Ln
- 2906 W 29th Ave
- 2607 W 33rd Ave
- 3830 Roald Amundsen Ave
- 3830 Roald Amundsen Ave Unit A
- 3830 Roald Amundsen Ave Unit B
- 3820 Roald Amundsen Ave Unit 10B
- 3820 Roald Amundsen Ave Unit 10A
- 3820 Roald Amundsen Ave
- 3910 Richard Evelyn Byrd St
- 3910 Richard Evelyn Byrd St Unit A
- 3910 Richard Evelyn Byrd St Unit B
- 3910 Richard Evelyn Byrd St Unit 12A
- 3910 Richard Evelyn Byrd St Unit 12B
- 3810 Roald Amundsen Ave Unit 9A
- 3810 Roald Amundsen Ave
- 3810 Roald Amundsen Ave Unit 8B
- 3810 Roald Amundsen Ave Unit A
- 3810 Roald Amundsen Ave Unit 8/2A
- 3905 Re Byrd St Unit 32B
- 3905 Re Byrd St Unit 32A
- 3866 Richard Evelyn Byrd St
- 3866 Richard Evelyn Byrd St Unit 16B