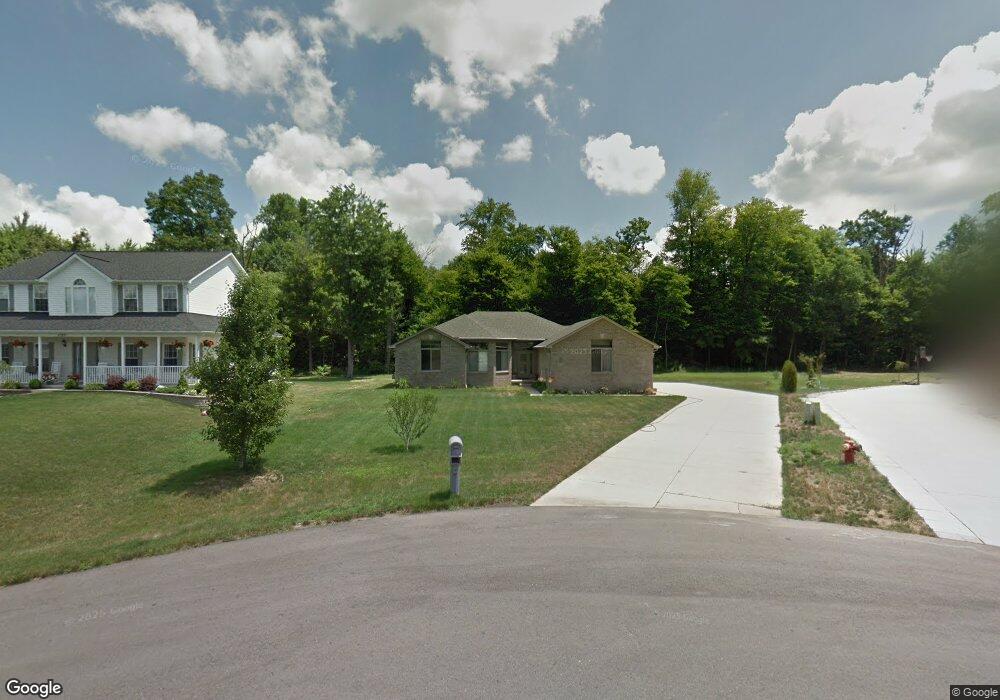
38301 Valley View Dr Unit 11 Romulus, MI 48174
Estimated Value: $388,000 - $421,000
3
Beds
3
Baths
2,092
Sq Ft
$194/Sq Ft
Est. Value
About This Home
This home is located at 38301 Valley View Dr Unit 11, Romulus, MI 48174 and is currently estimated at $405,089, approximately $193 per square foot. 38301 Valley View Dr Unit 11 is a home located in Wayne County with nearby schools including Barth Elementary School, Romulus Middle School, and Romulus Senior High School.
Ownership History
Date
Name
Owned For
Owner Type
Purchase Details
Closed on
Dec 6, 2021
Sold by
Smith Family Trust
Bought by
Smith Morris S and Vitella-Smith Debbie A
Current Estimated Value
Home Financials for this Owner
Home Financials are based on the most recent Mortgage that was taken out on this home.
Original Mortgage
$55,000
Interest Rate
3.09%
Mortgage Type
New Conventional
Purchase Details
Closed on
May 20, 2021
Sold by
Smith Morris S and Wtella Smith Debbie
Bought by
Smith Morris S and Wtella Smith Debbie
Purchase Details
Closed on
Feb 24, 2006
Sold by
Vitella Debbie
Bought by
Vitella Debbie Ann
Purchase Details
Closed on
Dec 8, 2003
Sold by
First Horizon Homes Llc
Bought by
Vitella Debbie
Create a Home Valuation Report for This Property
The Home Valuation Report is an in-depth analysis detailing your home's value as well as a comparison with similar homes in the area
Home Values in the Area
Average Home Value in this Area
Purchase History
| Date | Buyer | Sale Price | Title Company |
|---|---|---|---|
| Smith Morris S | -- | Progressive Title | |
| Smith Morris S | -- | None Available | |
| Vitella Debbie Ann | -- | Chicago Title Insurance Co | |
| Vitella Debbie | $70,000 | -- |
Source: Public Records
Mortgage History
| Date | Status | Borrower | Loan Amount |
|---|---|---|---|
| Previous Owner | Smith Morris S | $55,000 |
Source: Public Records
Tax History
| Year | Tax Paid | Tax Assessment Tax Assessment Total Assessment is a certain percentage of the fair market value that is determined by local assessors to be the total taxable value of land and additions on the property. | Land | Improvement |
|---|---|---|---|---|
| 2025 | $4,347 | $196,000 | $0 | $0 |
| 2024 | $4,367 | $181,300 | $0 | $0 |
| 2023 | $4,175 | $163,900 | $0 | $0 |
| 2022 | $4,983 | $148,800 | $0 | $0 |
| 2021 | $4,619 | $128,800 | $0 | $0 |
| 2020 | $4,528 | $128,000 | $0 | $0 |
| 2019 | $4,542 | $107,100 | $0 | $0 |
| 2018 | $2,894 | $110,200 | $0 | $0 |
| 2017 | $2,287 | $109,100 | $0 | $0 |
| 2016 | $3,883 | $112,500 | $0 | $0 |
| 2015 | $7,940 | $79,400 | $0 | $0 |
| 2013 | $8,310 | $88,500 | $0 | $0 |
| 2012 | $2,274 | $85,600 | $10,600 | $75,000 |
Source: Public Records
Map
Nearby Homes
- 16000 S Huron River Dr
- VL - S Huron River Dr
- 0000 Huron River Dr
- 17155 Theresa Ln
- 14560 Hannan Rd
- 17163 Theresa Ln
- 14354 Hannan Rd
- 37459 N Dianne Ln
- 14125 Conover Place
- 17966 Tall Oaks Ct
- 17978 Tall Oaks Ct
- 38236 Westvale St
- 13560 Aston St
- 38312 Castle Dr
- 00000 Savage Rd
- 38047 Wabash St
- 18736 Huron River Dr
- 19225 Savage Rd
- 41190 Savage Rd
- 36915 Sibley Rd
- 15991 Aspen Dr Unit 10
- 38523 Valley View Dr Unit 12
- 15983 Aspen Dr Unit 9
- 38635 Valley View Dr Unit 13
- 15877 Aspen Dr Unit 8
- 38647 Valley View Dr Unit 14
- 15982 Aspen Dr Unit 36
- 15876 Aspen Dr Unit 37
- 38701 Valley View Dr Unit 15
- 15753 Aspen Dr Unit 6
- 38725 Valley View Dr Unit 16
- 15752 Aspen Dr Unit 39
- 15741 Aspen Dr Unit 5
- 15992 Fern Dr Unit 33
- 15639 Aspen Dr Unit 4
- 38753 Valley View Dr Unit 17
- 15638 Aspen Dr Unit 41
- 16131 Hannan Rd
- 38787 Valley View Dr Unit 18