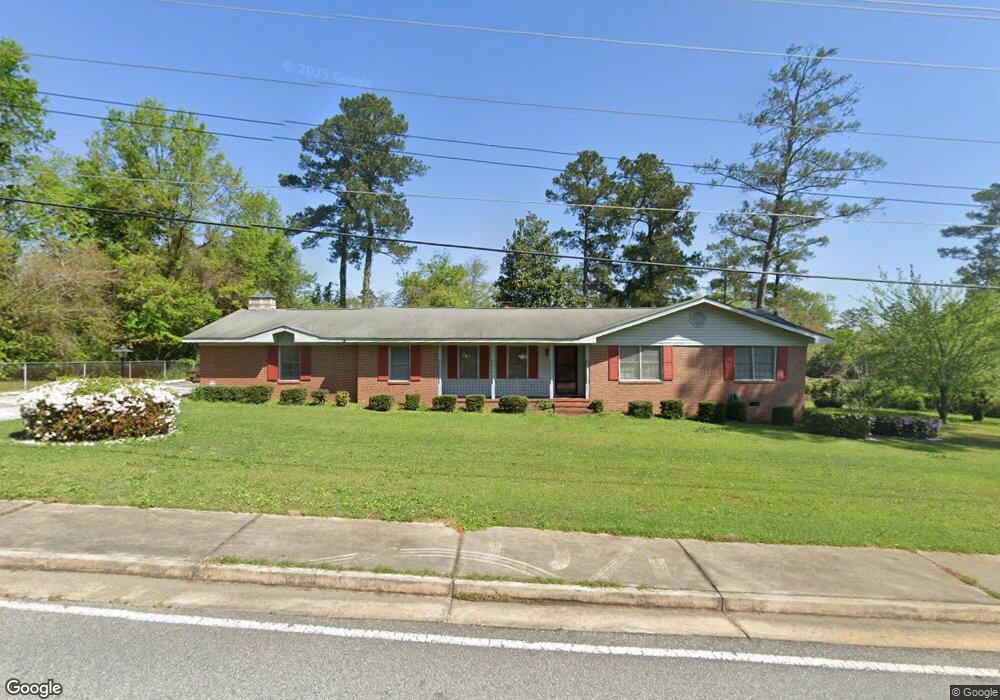
3831 Pine Forest Rd Macon, GA 31206
Estimated Value: $135,000 - $173,743
3
Beds
2
Baths
1,708
Sq Ft
$87/Sq Ft
Est. Value
About This Home
This home is located at 3831 Pine Forest Rd, Macon, GA 31206 and is currently estimated at $148,186, approximately $86 per square foot. 3831 Pine Forest Rd is a home located in Bibb County with nearby schools including Veterans Elementary School, Southwest High School, and Gilead Christian Academy.
Ownership History
Date
Name
Owned For
Owner Type
Purchase Details
Closed on
Dec 16, 2021
Sold by
Taylor Edward Warren
Bought by
Taylor Edward Warren and Taylor Jennifer Simmons
Current Estimated Value
Home Financials for this Owner
Home Financials are based on the most recent Mortgage that was taken out on this home.
Original Mortgage
$72,054
Interest Rate
3.12%
Mortgage Type
Credit Line Revolving
Purchase Details
Closed on
Oct 28, 2021
Sold by
Watson Sidney and Jackson Mildred N
Bought by
Taylor Edward W
Home Financials for this Owner
Home Financials are based on the most recent Mortgage that was taken out on this home.
Original Mortgage
$72,054
Interest Rate
3.12%
Mortgage Type
Credit Line Revolving
Purchase Details
Closed on
Nov 19, 2016
Sold by
Edward
Bought by
Taylor Edward and Johnson Bernice
Purchase Details
Closed on
Oct 2, 1995
Sold by
Jackson Edward
Bought by
Jackson Edward and Jackson Mildred N
Create a Home Valuation Report for This Property
The Home Valuation Report is an in-depth analysis detailing your home's value as well as a comparison with similar homes in the area
Home Values in the Area
Average Home Value in this Area
Purchase History
| Date | Buyer | Sale Price | Title Company |
|---|---|---|---|
| Taylor Edward Warren | -- | None Listed On Document | |
| Taylor Edward W | -- | None Available | |
| Taylor Edward | -- | -- | |
| Jackson Edward | -- | -- |
Source: Public Records
Mortgage History
| Date | Status | Borrower | Loan Amount |
|---|---|---|---|
| Closed | Taylor Edward Warren | $72,054 |
Source: Public Records
Tax History Compared to Growth
Tax History
| Year | Tax Paid | Tax Assessment Tax Assessment Total Assessment is a certain percentage of the fair market value that is determined by local assessors to be the total taxable value of land and additions on the property. | Land | Improvement |
|---|---|---|---|---|
| 2025 | $1,158 | $47,108 | $3,240 | $43,868 |
| 2024 | $1,196 | $47,108 | $3,240 | $43,868 |
| 2023 | $1,196 | $47,108 | $3,240 | $43,868 |
| 2022 | $1,473 | $42,537 | $7,058 | $35,479 |
| 2021 | $1,616 | $42,537 | $7,058 | $35,479 |
| 2020 | $1,113 | $42,537 | $7,058 | $35,479 |
| 2019 | $1,122 | $42,537 | $7,058 | $35,479 |
| 2018 | $1,897 | $42,537 | $7,058 | $35,479 |
| 2017 | $1,063 | $42,537 | $7,058 | $35,479 |
| 2016 | $971 | $42,537 | $7,058 | $35,479 |
| 2015 | $1,381 | $42,537 | $7,058 | $35,479 |
| 2014 | $1,675 | $42,537 | $7,058 | $35,479 |
Source: Public Records
Map
Nearby Homes
- 4738 Bloomfield Rd
- 3913 Blair Ct
- 3842 Wynnwood Dr
- 140 Spencer Hill Ct
- 3607 Pineland Trail
- 5060 Pinefield Dr
- 2868 Barrett Ave
- 2765 Alden St
- 4940 Pinefield Dr
- 4742 Bloomfield Rd
- 2443 Lambert Dr
- 2995 Virginia Dr
- 197 Camden Trace
- 165 Camden Trace
- 189 Camden Trace
- 120 Camden Trace
- 124 Camden Trace
- 193 Camden Trace
- 177 Camden Trace
- 2770 Bonnie Ave
- 3826 Woodside Dr
- 3804 Woodside Dr
- 3834 Woodside Dr
- 3834 Pine Forest Rd
- 3824 Pine Forest Rd
- 3848 Pine Forest Rd
- 3842 Woodside Dr
- 3788 Pine Forest Rd
- 3827 Woodside Dr
- 3819 Woodside Dr
- 3780 Pine Forest Rd
- 3835 Woodside Dr
- 3860 Pine Forest Rd
- 3860 Pine Forest Rd Unit 2
- 3803 Woodside Dr
- 3850 Woodside Dr
- 3811 Woodside Dr
- 3770 Pine Forest Rd
- 3843 Woodside Dr
- 5204 Bloomfield Rd