Estimated Value: $464,000 - $617,000
Studio
--
Bath
1,478
Sq Ft
$364/Sq Ft
Est. Value
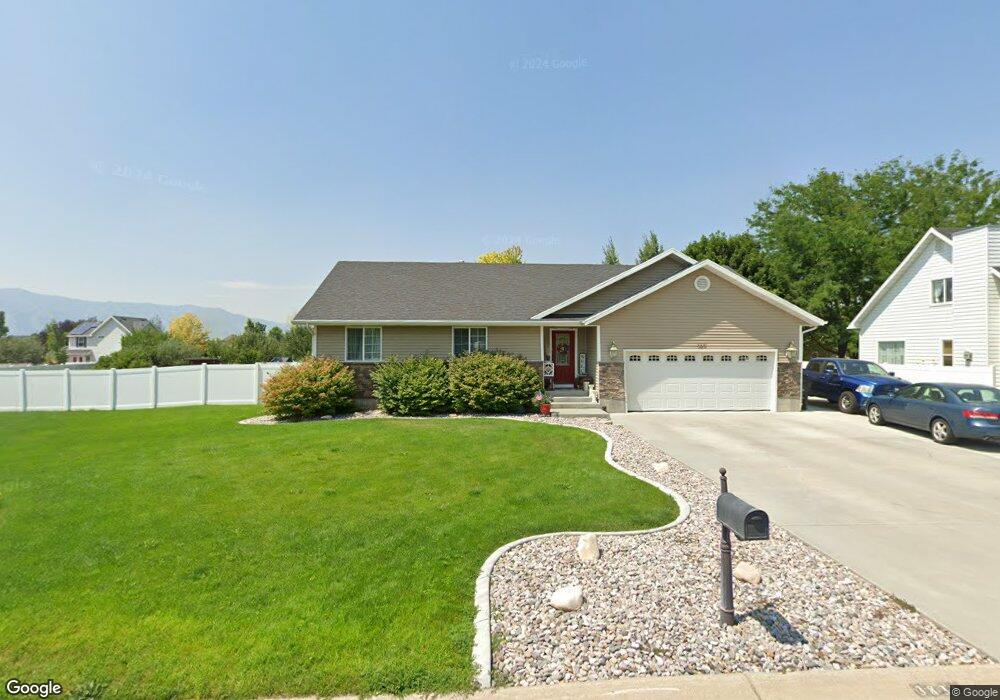
About This Home
This home is located at 3831 S 260 W, Logan, UT 84321 and is currently estimated at $538,543, approximately $364 per square foot. 3831 S 260 W is a home with nearby schools including Heritage School, Spring Creek Middle School, and South Cache Middle School.
Ownership History
Date
Name
Owned For
Owner Type
Purchase Details
Closed on
Jan 21, 2011
Sold by
Steadman Roland Max and Steadman Diann S
Bought by
Steadman Nathan Max and Steadman Valerie H
Current Estimated Value
Home Financials for this Owner
Home Financials are based on the most recent Mortgage that was taken out on this home.
Original Mortgage
$130,000
Outstanding Balance
$86,818
Interest Rate
4.82%
Mortgage Type
New Conventional
Estimated Equity
$451,726
Purchase Details
Closed on
Jul 12, 2010
Sold by
Steadman Roland Max and Steadman Diann S
Bought by
Steadman Roland Max and Steadman Diann S
Purchase Details
Closed on
Jun 2, 2006
Sold by
Nixon E J
Bought by
Bryan Daniel M and Bryan Rebecca L
Home Financials for this Owner
Home Financials are based on the most recent Mortgage that was taken out on this home.
Original Mortgage
$322,400
Interest Rate
6.52%
Mortgage Type
New Conventional
Create a Home Valuation Report for This Property
The Home Valuation Report is an in-depth analysis detailing your home's value as well as a comparison with similar homes in the area
Home Values in the Area
Average Home Value in this Area
Purchase History
| Date | Buyer | Sale Price | Title Company |
|---|---|---|---|
| Steadman Nathan Max | -- | Northern Title Company | |
| Steadman Roland Max | -- | Northern Title Company | |
| Steadman Roland Max | -- | Northern Title Company | |
| Bryan Daniel M | -- | Northern Title Company |
Source: Public Records
Mortgage History
| Date | Status | Borrower | Loan Amount |
|---|---|---|---|
| Open | Steadman Nathan Max | $130,000 | |
| Previous Owner | Bryan Daniel M | $322,400 |
Source: Public Records
Tax History
| Year | Tax Paid | Tax Assessment Tax Assessment Total Assessment is a certain percentage of the fair market value that is determined by local assessors to be the total taxable value of land and additions on the property. | Land | Improvement |
|---|---|---|---|---|
| 2025 | $2,110 | $279,670 | $0 | $0 |
| 2024 | $2,236 | $278,285 | $0 | $0 |
| 2023 | $2,343 | $273,075 | $0 | $0 |
| 2022 | $2,439 | $273,075 | $0 | $0 |
| 2021 | $2,112 | $367,275 | $70,000 | $297,275 |
| 2020 | $1,985 | $328,500 | $70,000 | $258,500 |
| 2019 | $1,719 | $271,331 | $70,000 | $201,331 |
| 2018 | $1,538 | $236,760 | $57,000 | $179,760 |
| 2017 | $1,539 | $125,510 | $0 | $0 |
| 2016 | $1,556 | $100,110 | $0 | $0 |
| 2015 | $1,233 | $100,110 | $0 | $0 |
| 2014 | $1,205 | $100,110 | $0 | $0 |
| 2013 | -- | $99,560 | $0 | $0 |
Source: Public Records
Map
Nearby Homes
- 396 W 3650 S
- 3923 Hillside Dr
- 271 W 2975 S Unit 725
- 278 W 3400 S Unit 10
- 294 W 3400 S Unit 9
- 338 W 3400 S Unit 6
- 267 W 2975 S Unit 726
- 268 W 3400 S Unit 5
- 3883 S 250 E
- 4009 S Cottonwoods Ct
- 4155 Johnson Rd
- 186 W 3175 S
- 186 W 3175 S Unit 617
- 178 W 3175 S
- 174 W 3175 S
- 174 W 3175 S Unit 620
- 3107 S 400 W
- 3085 225 West G204
- 3085 S 225 West G302
- 3085 225 West G304
- 3803 S 250 W
- 283 Schiess Ct
- 3728 S 300 W
- 3714 S 300 W
- 3854 S 260 W
- 246 Quarter Cir
- 3744 Sheridan Ridge Ln
- 275 Schiess Ct Unit 29
- 287 Schiess Ct Unit 26
- 285 Schiess Ct
- 285 W 3850 S
- 3700 S 300 W
- 245 Quarter Cir
- 3719 S 300 W
- 3856 S 260 W
- 3705 S 300 W
- 235 Quarter Cir
- 3760 S 300 W
- 3861 S 280 W
- 3685 S 300 W
Your Personal Tour Guide
Ask me questions while you tour the home.