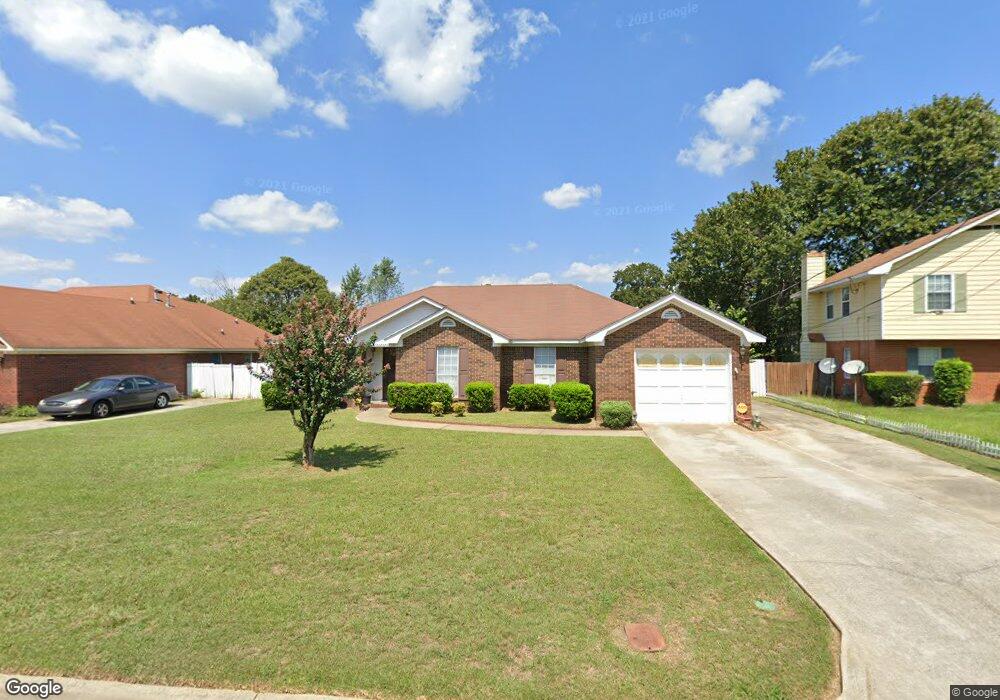
3831 Woodlake Dr Hephzibah, GA 30815
Jamestown NeighborhoodEstimated Value: $221,000 - $236,000
3
Beds
2
Baths
1,859
Sq Ft
$123/Sq Ft
Est. Value
About This Home
This home is located at 3831 Woodlake Dr, Hephzibah, GA 30815 and is currently estimated at $228,235, approximately $122 per square foot. 3831 Woodlake Dr is a home located in Richmond County with nearby schools including R.B. Hunt Elementary School, Deer Chase Elementary School, and Hephzibah Middle School.
Ownership History
Date
Name
Owned For
Owner Type
Purchase Details
Closed on
Jun 6, 2016
Sold by
Mitchell Brooks
Bought by
Porter Diane Mitchell
Current Estimated Value
Purchase Details
Closed on
Jul 30, 2003
Sold by
Mitchell Marion A
Bought by
Mitchell Brooks
Home Financials for this Owner
Home Financials are based on the most recent Mortgage that was taken out on this home.
Original Mortgage
$80,190
Interest Rate
5.52%
Mortgage Type
Purchase Money Mortgage
Purchase Details
Closed on
Jan 7, 2003
Sold by
Washington Mutual Bank Fa
Bought by
Va
Purchase Details
Closed on
Aug 31, 1993
Sold by
Brown Arles L
Bought by
Nunnally Marquis L
Purchase Details
Closed on
Jul 26, 1990
Sold by
Youngblood Nell
Bought by
Brown Arles L
Purchase Details
Closed on
Nov 1, 1989
Sold by
Clarke Estates Deve
Bought by
Youngblood Nell
Create a Home Valuation Report for This Property
The Home Valuation Report is an in-depth analysis detailing your home's value as well as a comparison with similar homes in the area
Home Values in the Area
Average Home Value in this Area
Purchase History
| Date | Buyer | Sale Price | Title Company |
|---|---|---|---|
| Porter Diane Mitchell | -- | -- | |
| Mitchell Brooks | -- | -- | |
| Mitchell Marion A | -- | -- | |
| Mitchell Brooks | $89,100 | -- | |
| Va | -- | -- | |
| Washington Mutual Bank Fa | $69,623 | -- | |
| Nunnally Marquis L | $85,900 | -- | |
| Brown Arles L | $72,900 | -- | |
| Youngblood Nell | $12,000 | -- |
Source: Public Records
Mortgage History
| Date | Status | Borrower | Loan Amount |
|---|---|---|---|
| Previous Owner | Mitchell Brooks | $80,190 |
Source: Public Records
Tax History Compared to Growth
Tax History
| Year | Tax Paid | Tax Assessment Tax Assessment Total Assessment is a certain percentage of the fair market value that is determined by local assessors to be the total taxable value of land and additions on the property. | Land | Improvement |
|---|---|---|---|---|
| 2025 | $2,818 | $87,384 | $9,200 | $78,184 |
| 2024 | $2,818 | $85,032 | $9,200 | $75,832 |
| 2023 | $855 | $80,040 | $9,200 | $70,840 |
| 2022 | $910 | $59,690 | $9,200 | $50,490 |
| 2021 | $848 | $48,974 | $9,200 | $39,774 |
| 2020 | $853 | $48,974 | $9,200 | $39,774 |
| 2019 | $885 | $48,974 | $9,200 | $39,774 |
| 2018 | $889 | $48,974 | $9,200 | $39,774 |
| 2017 | $854 | $48,974 | $9,200 | $39,774 |
| 2016 | $854 | $48,974 | $9,200 | $39,774 |
| 2015 | $854 | $48,974 | $9,200 | $39,774 |
| 2014 | $854 | $48,974 | $9,200 | $39,774 |
Source: Public Records
Map
Nearby Homes
- 3823 Woodlake Dr
- 3904 Ellen St
- 3462 Firestone Dr
- 3466 Firestone Dr
- 3442 Firestone Dr
- 3438 Firestone Dr
- 3436 Firestone Dr
- 3426 Firestone Dr Unit 154
- 3936 Ellen St
- 3492 Firestone Dr
- 5446 Thrasher Ln
- 3422 Firestone Dr
- 3434 Firestone Dr Unit 151
- 3420 Firestone Dr Unit 157
- 3418 Firestone Dr Unit 158
- 3424 Firestone Dr
- 3424 Firestone Dr Unit 155
- 3434 Firestone Dr
- 3422 Firestone Dr Unit 156
- Maywood 3 Plan at Laurel Park Townhomes
- 3829 Woodlake Dr
- 3833 Woodlake Dr
- 3837 Woodlake Dr
- 3827 Woodlake Dr
- 3846 Woodlake Dr
- 3848 Woodlake Dr
- 3844 Woodlake Dr
- 3850 Woodlake Dr
- 3825 Woodlake Dr
- 3842 Woodlake Dr
- 4010 Nuite Dr
- 4008 Nuite Dr
- 4012 Nuite Dr
- 3852 Woodlake Dr
- 4022 Nuite Dr
- 3839 Woodlake Dr
- 4006 Nuite Dr
- 4014 Nuite Dr
- 4020 Nuite Dr
- 3840 Woodlake Dr