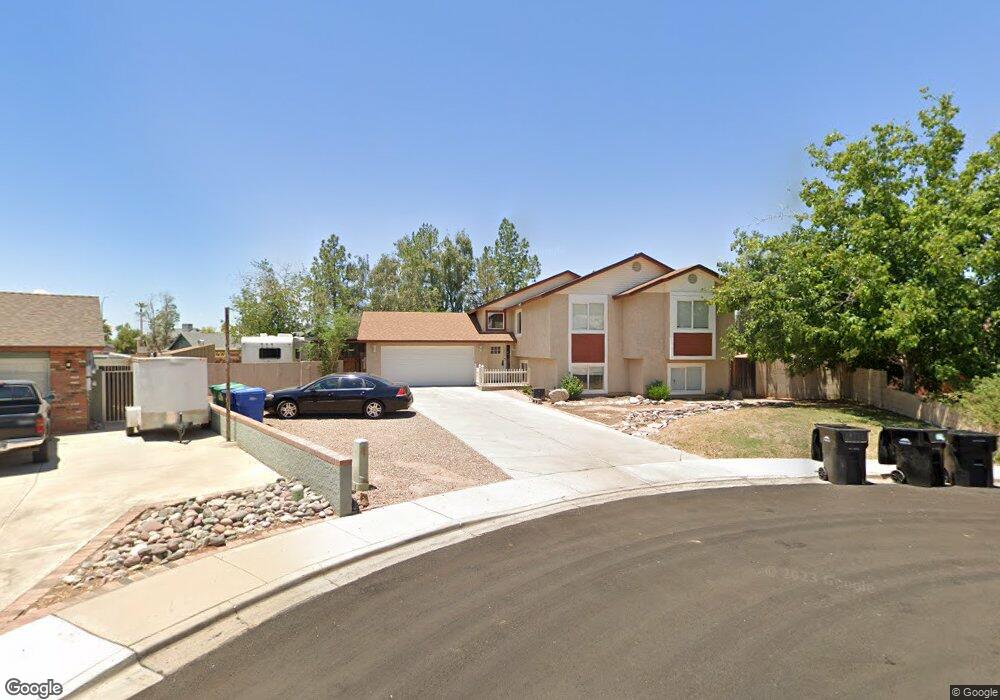
3832 E Dewberry Ave Unit *WOW* Mesa, AZ 85206
Central Mesa NeighborhoodEstimated Value: $487,059 - $621,000
About This Home
This home is located at 3832 E Dewberry Ave Unit *WOW*, Mesa, AZ 85206 and is currently estimated at $563,265, approximately $203 per square foot. 3832 E Dewberry Ave Unit *WOW* is a home located in Maricopa County with nearby schools including Johnson Elementary School, Franklin at Brimhall Elementary School, and Franklin West Elementary School.
Ownership History
We collect this data history from publicly available records. To have your information removed, we recommend requesting removal directly through your county’s website.
Purchase Details
Home Financials for this Owner
Home Financials are based on the most recent Mortgage that was taken out on this home.Purchase Details
Home Financials for this Owner
Home Financials are based on the most recent Mortgage that was taken out on this home.Home Values in the Area
Average Home Value in this Area
Purchase History
We collect this data history from publicly available records. To have your information removed, we recommend requesting removal directly through your county’s website.
| Date | Buyer | Sale Price | Title Company |
|---|---|---|---|
| $196,000 | First American Title Ins Co | ||
| -- | Security Title Agency |
Mortgage History
We collect this data history from publicly available records. To have your information removed, we recommend requesting removal directly through your county’s website.
| Date | Status | Borrower | Loan Amount |
|---|---|---|---|
| Open | $156,880 | ||
| Previous Owner | $167,890 | ||
| Closed | $29,415 |
Tax History
We collect this data history from publicly available records. To have your information removed, we recommend requesting removal directly through your county’s website.
| Year | Tax Paid | Tax Assessment Tax Assessment Total Assessment is a certain percentage of the fair market value that is determined by local assessors to be the total taxable value of land and additions on the property. | Land | Improvement |
|---|---|---|---|---|
| 2025 | $1,820 | $21,918 | -- | -- |
| 2024 | $1,840 | $20,874 | -- | -- |
| 2023 | $1,840 | $39,100 | $7,820 | $31,280 |
| 2022 | $1,800 | $30,410 | $6,080 | $24,330 |
| 2021 | $1,849 | $29,070 | $5,810 | $23,260 |
| 2020 | $1,824 | $27,270 | $5,450 | $21,820 |
| 2019 | $1,690 | $25,080 | $5,010 | $20,070 |
| 2018 | $1,614 | $22,650 | $4,530 | $18,120 |
| 2017 | $1,563 | $21,050 | $4,210 | $16,840 |
| 2016 | $1,535 | $20,520 | $4,100 | $16,420 |
| 2015 | $1,449 | $19,870 | $3,970 | $15,900 |
Map
- 3747 E Dulciana Ave
- 3755 E Broadway Rd Unit 16
- 3821 E Delta Ave
- 3824 E Pueblo Ave
- 441 S Maple Unit 162
- 441 S Maple Unit 8
- 3544 E Diamond Ave
- 4045 E Capri Ave
- 4023 E Clovis Cir
- 4036 E Clovis Cir
- 342 S 40th St Unit 3
- 342 S 40th St Unit 61
- 4056 E Capri Ave
- 440 S Val Vista Dr Unit 54
- 4032 E Catalina Cir
- 3420 E Dragoon Ave
- 3449 E Delta Ave
- 3752 E Emerald Ave
- 305 S Val Vista Dr Unit 71
- 305 S Val Vista Dr Unit 49
- 3832 E Dewberry Ave
- 3830 E Dewberry Ave
- 3758 E Dragoon Ave
- 3762 E Dragoon Ave
- 3764 E Dragoon Ave
- 3754 E Dragoon Ave
- 3836 E Dewberry Ave
- 3765 E Clovis Ave
- 3765 E Clovis Ave
- 3829 E Clovis Ave
- 3838 E Dewberry Ave
- 3759 E Clovis Ave
- 3807 E Clovis Ave
- 3825 E Dewberry Ave
- 3829 E Dewberry Ave
- 3753 E Clovis Ave
- 10347 S Dragoon Ave
- 3815 E Clovis Ave
- 3819 E Dewberry Ave
- 3835 E Dewberry Ave
Ask me questions while you tour the home.