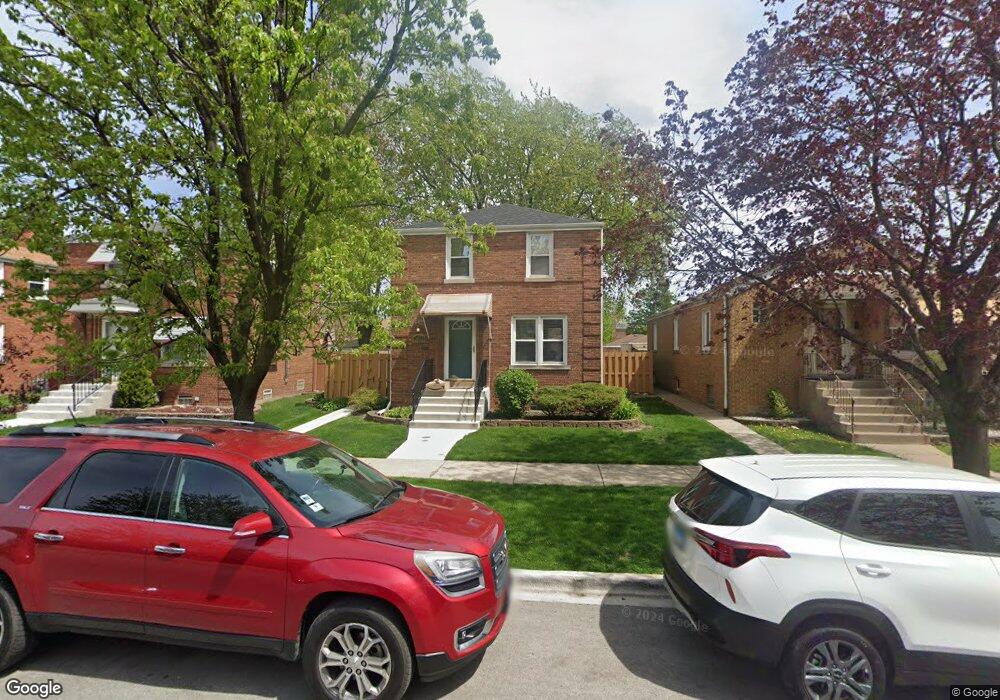
3833 S 59th Ave Cicero, IL 60804
Estimated Value: $261,000 - $326,000
2
Beds
1
Bath
990
Sq Ft
$287/Sq Ft
Est. Value
About This Home
This home is located at 3833 S 59th Ave, Cicero, IL 60804 and is currently estimated at $284,622, approximately $287 per square foot. 3833 S 59th Ave is a home located in Cook County with nearby schools including Abraham Lincoln Elementary School, Unity Jr High School, and J Sterling Morton Freshman Center.
Ownership History
Date
Name
Owned For
Owner Type
Purchase Details
Closed on
Jan 14, 2010
Sold by
Nerud Jeffery S
Bought by
Zavala Gerardo V
Current Estimated Value
Home Financials for this Owner
Home Financials are based on the most recent Mortgage that was taken out on this home.
Original Mortgage
$130,591
Outstanding Balance
$86,348
Interest Rate
5.09%
Mortgage Type
FHA
Estimated Equity
$198,274
Purchase Details
Closed on
Jul 14, 2009
Sold by
Lasalle Bank National Association
Bought by
Nerud Jeffrey S
Purchase Details
Closed on
Mar 13, 2009
Sold by
Schlade Robert
Bought by
Lasalle Bank National Association
Purchase Details
Closed on
Mar 28, 2006
Sold by
Dye Eileen M and Sullivan Edward Morgan
Bought by
Schlade Robert
Home Financials for this Owner
Home Financials are based on the most recent Mortgage that was taken out on this home.
Original Mortgage
$184,300
Interest Rate
9.15%
Mortgage Type
Unknown
Create a Home Valuation Report for This Property
The Home Valuation Report is an in-depth analysis detailing your home's value as well as a comparison with similar homes in the area
Home Values in the Area
Average Home Value in this Area
Purchase History
| Date | Buyer | Sale Price | Title Company |
|---|---|---|---|
| Zavala Gerardo V | $133,000 | Pntn | |
| Nerud Jeffrey S | $46,000 | Premier Title Company | |
| Lasalle Bank National Association | -- | None Available | |
| Schlade Robert | $194,000 | Stewart Title Of Illinois |
Source: Public Records
Mortgage History
| Date | Status | Borrower | Loan Amount |
|---|---|---|---|
| Open | Zavala Gerardo V | $130,591 | |
| Previous Owner | Schlade Robert | $184,300 |
Source: Public Records
Tax History Compared to Growth
Tax History
| Year | Tax Paid | Tax Assessment Tax Assessment Total Assessment is a certain percentage of the fair market value that is determined by local assessors to be the total taxable value of land and additions on the property. | Land | Improvement |
|---|---|---|---|---|
| 2024 | $5,306 | $19,000 | $5,418 | $13,582 |
| 2023 | $5,613 | $19,000 | $5,418 | $13,582 |
| 2022 | $5,613 | $16,273 | $4,662 | $11,611 |
| 2021 | $5,587 | $16,272 | $4,662 | $11,610 |
| 2020 | $5,527 | $16,272 | $4,662 | $11,610 |
| 2019 | $4,044 | $11,718 | $4,284 | $7,434 |
| 2018 | $3,937 | $11,718 | $4,284 | $7,434 |
| 2017 | $3,818 | $11,718 | $4,284 | $7,434 |
| 2016 | $3,429 | $9,643 | $3,528 | $6,115 |
| 2015 | $3,329 | $9,643 | $3,528 | $6,115 |
| 2014 | $3,233 | $9,643 | $3,528 | $6,115 |
| 2013 | $3,595 | $11,329 | $3,528 | $7,801 |
Source: Public Records
Map
Nearby Homes
- 3817 S 58th Ave
- 3744 S 59th Ct
- 3736 S 58th Ave
- 5728 W Pershing Rd
- 3719 S Austin Blvd
- 3703 S 58th Ct
- 3820 S 57th Ave
- 3733 S 57th Ave
- 3615 S 59th Ct
- 3633 S 57th Ct
- 3539 S 57th Ct
- 3734 Lombard Ave
- 3744 S Harvey Ave
- 3610 Lombard Ave
- 3631 S 55th Ct
- 3426 S 58th Ave
- 3604 Lombard Ave
- 3524 S Central Ave
- 3518 Harvey Ave
- 3413 S 56th Ct
- 3835 S 59th Ave
- 3825 S 59th Ave
- 3823 S 59th Ave
- 5842 W Pershing Rd
- 5844 W Pershing Rd
- 5840 W Pershing Rd
- 5846 W Pershing Rd
- 5838 W Pershing Rd
- 3830 S 58th Ct
- 3828 S 58th Ct
- 3832 S 58th Ct
- 3832 S 59th Ave
- 3819 S 59th Ave
- 3824 S 58th Ct
- 3830 S 59th Ave
- 5836 W Pershing Rd
- 5836 W Pershing Rd
- 3824 S 59th Ave
- 3820 S 58th Ct