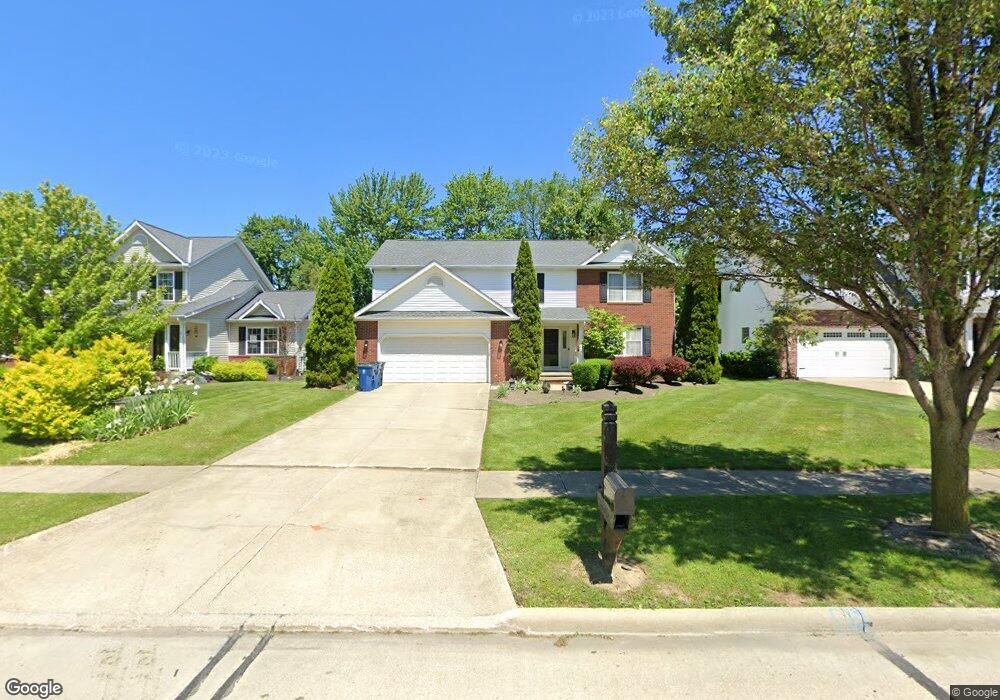
38335 Brighton Path Willoughby, OH 44094
Estimated Value: $366,000 - $446,000
4
Beds
3
Baths
1,394
Sq Ft
$288/Sq Ft
Est. Value
About This Home
This home is located at 38335 Brighton Path, Willoughby, OH 44094 and is currently estimated at $400,948, approximately $287 per square foot. 38335 Brighton Path is a home located in Lake County with nearby schools including Grant Elementary School, Willoughby Middle School, and South High School.
Ownership History
Date
Name
Owned For
Owner Type
Purchase Details
Closed on
Jul 22, 2006
Sold by
Hallahan Peter and Hallahan Mary Jane
Bought by
Werner Lonnie and Werner Julie D
Current Estimated Value
Home Financials for this Owner
Home Financials are based on the most recent Mortgage that was taken out on this home.
Original Mortgage
$272,600
Outstanding Balance
$159,110
Interest Rate
6.73%
Mortgage Type
Purchase Money Mortgage
Estimated Equity
$241,838
Purchase Details
Closed on
Mar 30, 2001
Sold by
Johr Home Design Inc
Bought by
Hallahan Peter and Hallahan Mary Jane
Home Financials for this Owner
Home Financials are based on the most recent Mortgage that was taken out on this home.
Original Mortgage
$191,900
Interest Rate
6.5%
Purchase Details
Closed on
Sep 17, 1999
Sold by
Twentieth Century Construction Co
Bought by
Westminster Abbey Inc
Purchase Details
Closed on
Apr 10, 1999
Sold by
Westminster Abbey Inc
Bought by
Johr Home Design Inc
Create a Home Valuation Report for This Property
The Home Valuation Report is an in-depth analysis detailing your home's value as well as a comparison with similar homes in the area
Home Values in the Area
Average Home Value in this Area
Purchase History
| Date | Buyer | Sale Price | Title Company |
|---|---|---|---|
| Werner Lonnie | $303,000 | Enterprise Title | |
| Hallahan Peter | $241,900 | Insured Title | |
| Westminster Abbey Inc | -- | Realty Title Agency Inc | |
| Johr Home Design Inc | $133,800 | Realty Title Agency Inc |
Source: Public Records
Mortgage History
| Date | Status | Borrower | Loan Amount |
|---|---|---|---|
| Open | Werner Lonnie | $272,600 | |
| Previous Owner | Hallahan Peter | $191,900 |
Source: Public Records
Tax History
| Year | Tax Paid | Tax Assessment Tax Assessment Total Assessment is a certain percentage of the fair market value that is determined by local assessors to be the total taxable value of land and additions on the property. | Land | Improvement |
|---|---|---|---|---|
| 2025 | -- | $131,000 | $32,360 | $98,640 |
| 2024 | -- | $131,000 | $32,360 | $98,640 |
| 2023 | $10,123 | $106,920 | $25,840 | $81,080 |
| 2022 | $6,543 | $106,920 | $25,840 | $81,080 |
| 2021 | $6,572 | $106,920 | $25,840 | $81,080 |
| 2020 | $6,408 | $92,970 | $22,470 | $70,500 |
| 2019 | $5,943 | $92,970 | $22,470 | $70,500 |
| 2018 | $5,999 | $91,710 | $22,470 | $69,240 |
| 2017 | $6,137 | $91,710 | $22,470 | $69,240 |
| 2016 | $6,114 | $91,710 | $22,470 | $69,240 |
| 2015 | $5,964 | $91,710 | $22,470 | $69,240 |
| 2014 | $5,661 | $91,710 | $22,470 | $69,240 |
| 2013 | $5,664 | $91,710 | $22,470 | $69,240 |
Source: Public Records
Map
Nearby Homes
- 2640 Lost Nation Rd
- 0 Lost Nation Rd
- 38109 Poplar Dr
- 3000 Steve Guard Ct
- 38754 Adkins Rd
- 541 Howells Ct
- 450 Brookdale Dr
- 36988 Clearway Dr
- 7225 Hulls Cove
- 346 Parkway Dr
- 35931 Woodland Dr
- 3 Adkins Rd
- 36587 Spindrift Dr
- 38125 Highgate Bluff Ln
- 35783 Lake Shore Blvd
- 7325 Adkins Rd
- 35965 Lake Shore Blvd
- 211 W Overlook Dr
- 2048 Forest Dr
- V/L 13-14 Carlton Dr
- 38325 Brighton Path
- 38345 Brighton Path
- 38330 Westminster Ln
- 38315 Brighton Path
- 38355 Brighton Path
- 38320 Westminster Ln
- 38340 Westminster Ln
- 38310 Westminster Ln
- 38350 Westminster Ln
- 38305 Brighton Path
- 38365 Brighton Path
- 38350 Brighton Path
- 38290 Westminster Ln
- 38370 Westminster Ln
- 38295 Brighton Path
- 38375 Brighton Path
- 38280 Westminster Ln
- 38380 Westminster Ln
- 38280 Brighton Path
- 38345 Westminster Ln
Your Personal Tour Guide
Ask me questions while you tour the home.