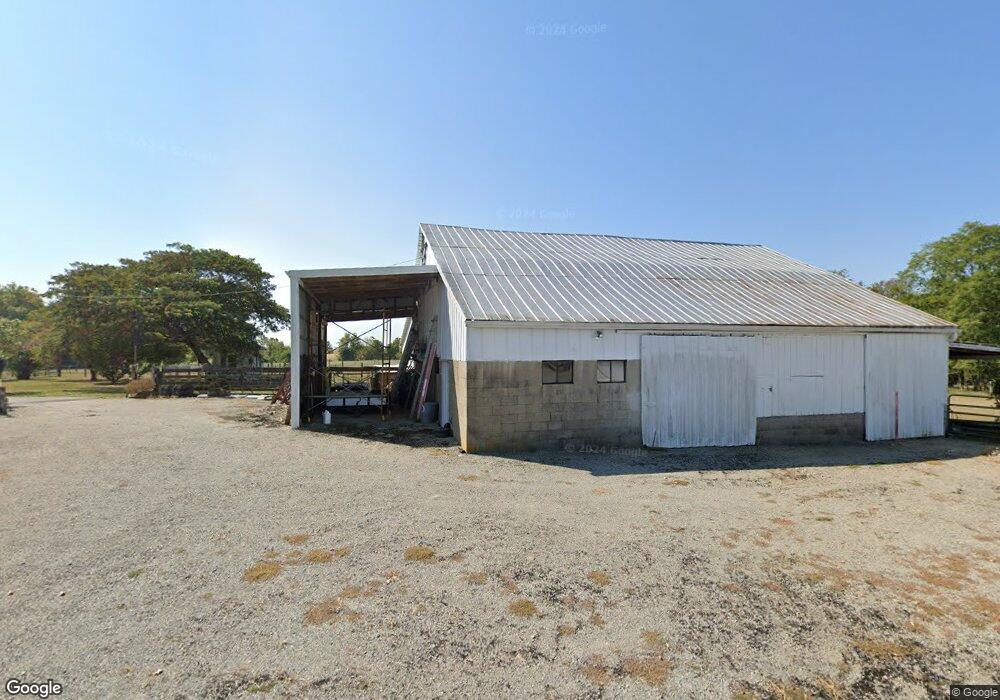
3834 Shaw Rd Georgetown, OH 45121
Estimated Value: $309,000 - $496,000
4
Beds
2
Baths
1,736
Sq Ft
$219/Sq Ft
Est. Value
About This Home
This home is located at 3834 Shaw Rd, Georgetown, OH 45121 and is currently estimated at $379,724, approximately $218 per square foot. 3834 Shaw Rd is a home located in Brown County with nearby schools including Georgetown Elementary School and Georgetown Jr/Sr High School.
Ownership History
Date
Name
Owned For
Owner Type
Purchase Details
Closed on
Aug 1, 2000
Sold by
Braziel Lee R
Bought by
Hughes Larry J and Hughes Carolyn
Current Estimated Value
Home Financials for this Owner
Home Financials are based on the most recent Mortgage that was taken out on this home.
Original Mortgage
$60,000
Interest Rate
8.27%
Mortgage Type
New Conventional
Purchase Details
Closed on
Oct 20, 1997
Sold by
Ring Charles L
Bought by
Braziel Mary J
Home Financials for this Owner
Home Financials are based on the most recent Mortgage that was taken out on this home.
Original Mortgage
$102,648
Interest Rate
7.65%
Mortgage Type
New Conventional
Purchase Details
Closed on
Aug 16, 1995
Sold by
Pfeffer Stephen B
Bought by
Thomas Alfred F
Home Financials for this Owner
Home Financials are based on the most recent Mortgage that was taken out on this home.
Original Mortgage
$85,000
Interest Rate
7.64%
Mortgage Type
New Conventional
Create a Home Valuation Report for This Property
The Home Valuation Report is an in-depth analysis detailing your home's value as well as a comparison with similar homes in the area
Purchase History
| Date | Buyer | Sale Price | Title Company |
|---|---|---|---|
| Hughes Larry J | $180,000 | -- | |
| Braziel Mary J | $139,000 | -- | |
| Thomas Alfred F | $30,000 | -- |
Source: Public Records
Mortgage History
| Date | Status | Borrower | Loan Amount |
|---|---|---|---|
| Closed | Hughes Larry J | $60,000 | |
| Previous Owner | Braziel Mary J | $102,648 | |
| Previous Owner | Thomas Alfred F | $85,000 |
Source: Public Records
Tax History
| Year | Tax Paid | Tax Assessment Tax Assessment Total Assessment is a certain percentage of the fair market value that is determined by local assessors to be the total taxable value of land and additions on the property. | Land | Improvement |
|---|---|---|---|---|
| 2024 | $1,881 | $78,100 | $24,640 | $53,460 |
| 2023 | $1,891 | $62,800 | $21,150 | $41,650 |
| 2022 | $1,448 | $62,800 | $21,150 | $41,650 |
| 2021 | $1,432 | $62,800 | $21,150 | $41,650 |
| 2020 | $1,313 | $54,610 | $18,400 | $36,210 |
| 2019 | $1,302 | $54,610 | $18,400 | $36,210 |
| 2018 | $1,308 | $48,710 | $12,500 | $36,210 |
| 2017 | $1,389 | $50,830 | $14,440 | $36,390 |
| 2016 | $1,389 | $50,830 | $14,440 | $36,390 |
| 2015 | $1,246 | $50,830 | $14,440 | $36,390 |
| 2014 | $1,246 | $45,240 | $8,850 | $36,390 |
| 2013 | $1,242 | $45,240 | $8,850 | $36,390 |
Source: Public Records
Map
Nearby Homes
- 7029 Free Soil Rd
- 3571 Shaw Rd
- 470 Free Soil Rd
- 20 Heritage Hill Dr
- 7480 Old Us Highway 68
- 38 Dell Acres Dr
- 0 St Rt 221 & Footbridge Unit 1826509
- 155 Free Soil Rd
- 175 Douglas Cir
- 510 W State St
- 505 S Water St
- 25 Douglas Ln
- 666 E State St
- 405 N Main St
- 708 E State St
- 406 E North St
- 3755 Old A & P Hwy
- 399 Elmwood Ct
- 60 New St
- 508 Mount Orab Pike
- 3794 Shaw Rd
- 12.230ac Shaw Rd
- 3878 Shaw Rd
- 3709 Shaw Rd
- 0 Shaw Rd Unit 1104878
- 0 Shaw Rd Unit 1153421
- 0 Shaw Rd Unit 1206501
- 0 Shaw Rd Unit 1329408
- 0 Shaw Rd Unit 1337181
- 0 Shaw Rd Unit 1406266
- 0 Shaw Rd Unit 1409655
- 0 Shaw Rd Unit 1056495
- 0 Shaw Rd Unit 1056493
- 6921 Free Soil Rd
- 3789 Loudon Rd
- 3731 Loudon Rd
- 3743 Loudon Rd
- 6651 Free Soil Rd
- 3699 Loudon Rd
- 6639 Free Soil Rd
Your Personal Tour Guide
Ask me questions while you tour the home.