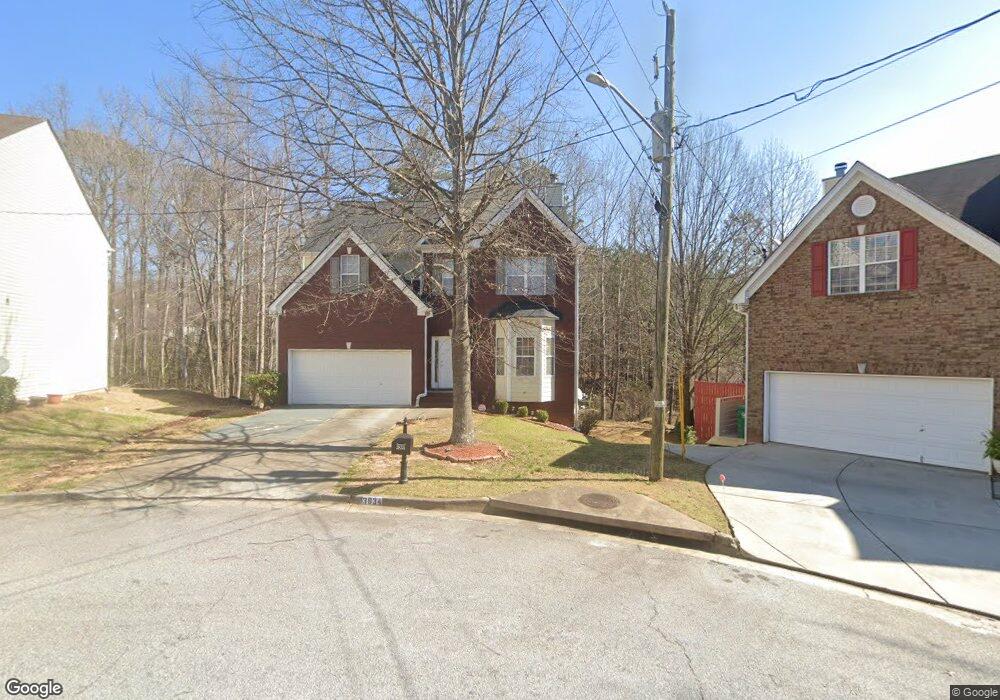
3834 Walnut Path Lithonia, GA 30038
Estimated Value: $269,000 - $298,000
4
Beds
4
Baths
2,094
Sq Ft
$135/Sq Ft
Est. Value
About This Home
This home is located at 3834 Walnut Path, Lithonia, GA 30038 and is currently estimated at $282,938, approximately $135 per square foot. 3834 Walnut Path is a home located in DeKalb County with nearby schools including Flat Rock Elementary School, Salem Middle School, and Martin Luther King- Jr. High School.
Ownership History
Date
Name
Owned For
Owner Type
Purchase Details
Closed on
Dec 14, 2010
Sold by
Federal Natl Mtg Assn Fnma
Bought by
Chriswell Erica
Current Estimated Value
Home Financials for this Owner
Home Financials are based on the most recent Mortgage that was taken out on this home.
Original Mortgage
$84,794
Outstanding Balance
$57,298
Interest Rate
4.75%
Mortgage Type
FHA
Estimated Equity
$225,640
Purchase Details
Closed on
Sep 7, 2010
Sold by
Suntrust Mtg Inc
Bought by
Federal Natl Mtg Assn Fnma
Purchase Details
Closed on
Oct 5, 2006
Sold by
Paramount Properties Inc
Bought by
Snapp Joanne
Home Financials for this Owner
Home Financials are based on the most recent Mortgage that was taken out on this home.
Original Mortgage
$124,000
Interest Rate
6.36%
Mortgage Type
New Conventional
Purchase Details
Closed on
Dec 29, 2005
Sold by
Sims Catherine E
Bought by
Paramount Properties Inc
Purchase Details
Closed on
Feb 17, 2003
Sold by
Bowen Builders Grp Inc
Bought by
Sims Catherine E
Create a Home Valuation Report for This Property
The Home Valuation Report is an in-depth analysis detailing your home's value as well as a comparison with similar homes in the area
Home Values in the Area
Average Home Value in this Area
Purchase History
| Date | Buyer | Sale Price | Title Company |
|---|---|---|---|
| Chriswell Erica | -- | -- | |
| Federal Natl Mtg Assn Fnma | -- | -- | |
| Suntrust Mtg Inc | $130,072 | -- | |
| Snapp Joanne | $155,000 | -- | |
| Paramount Properties Inc | $80,600 | -- | |
| Sims Catherine E | $162,400 | -- |
Source: Public Records
Mortgage History
| Date | Status | Borrower | Loan Amount |
|---|---|---|---|
| Open | Chriswell Erica | $84,794 | |
| Previous Owner | Snapp Joanne | $124,000 |
Source: Public Records
Tax History
| Year | Tax Paid | Tax Assessment Tax Assessment Total Assessment is a certain percentage of the fair market value that is determined by local assessors to be the total taxable value of land and additions on the property. | Land | Improvement |
|---|---|---|---|---|
| 2025 | $3,154 | $117,680 | $20,000 | $97,680 |
| 2024 | $3,222 | $118,720 | $20,000 | $98,720 |
| 2023 | $3,222 | $116,200 | $20,000 | $96,200 |
Source: Public Records
Map
Nearby Homes
- 3812 Walnut Path
- 5471 Walnut Ln
- 5487 Walnut Ln
- 3635 Crossvale Rd
- 3703 Salem Springs Ct
- 5438 Salem Springs Dr
- 5331 Salem Rd
- 3646 Salem Dr
- 5263 Salem Rd
- 5415 Radford Ln
- 5209 Salem Rd
- 3729 Salem Trail
- 5660 Fox Hound Trail
- 3722 Salem Trail
- 3591 Bramblevine Cir Unit 2
- 5728 Salem Rd
- 3579 Bramblevine Cir
- 3439 Bleckley Dr
- 3852 Panola Rd
- 5664 Reynard Trail
- 3830 Walnut Path
- 3838 Walnut Path
- 3824 Walnut Path
- 3839 Walnut Path
- 3818 Walnut Path
- 3831 Walnut Path
- 3835 Walnut Path
- 3825 Walnut Path
- 3819 Walnut Path
- 3853 Walnut Dr
- 3813 Walnut Path
- 3806 Walnut Path
- 3849 Walnut Dr Unit 1
- 3774 Walnut Creek Way
- 3904 Walnut Creek Trace
- 3780 Walnut Creek Way
- 3852 Walnut Dr
- 3768 Walnut Creek Way
- 3807 Walnut Path
- 3807 Walnut Path Unit 51
Your Personal Tour Guide
Ask me questions while you tour the home.