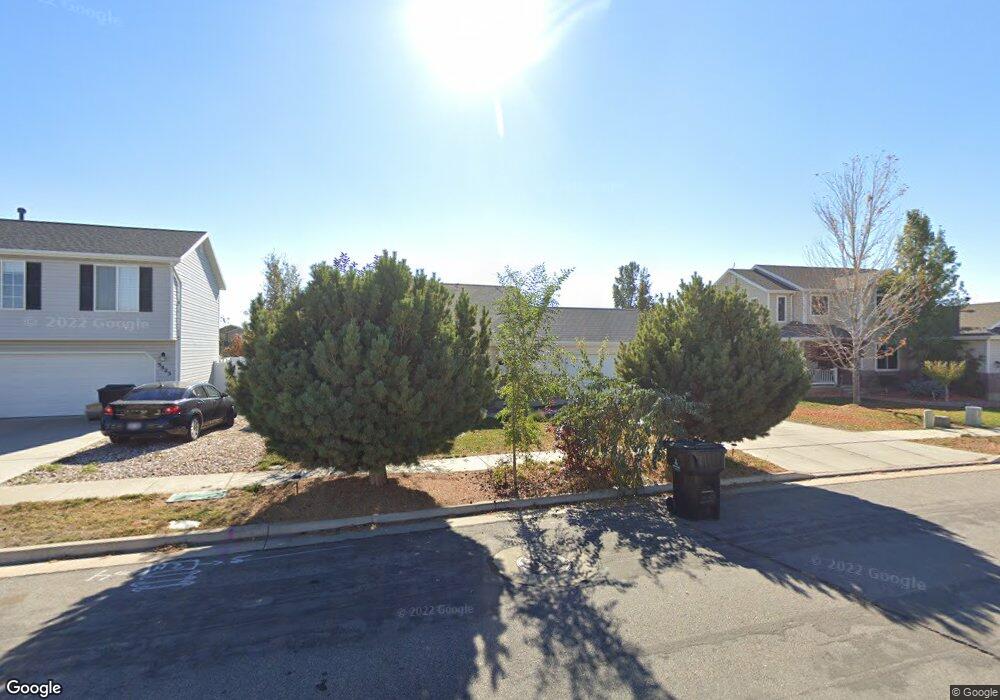
3835 W 800 S Syracuse, UT 84075
Estimated Value: $369,000 - $471,000
3
Beds
1
Bath
1,050
Sq Ft
$393/Sq Ft
Est. Value
About This Home
This home is located at 3835 W 800 S, Syracuse, UT 84075 and is currently estimated at $412,523, approximately $392 per square foot. 3835 W 800 S is a home located in Davis County with nearby schools including West Point School, West Point Junior High School, and Syracuse High School.
Ownership History
Date
Name
Owned For
Owner Type
Purchase Details
Closed on
Aug 30, 2005
Sold by
Contreras Manuel M and Medrano Karla S
Bought by
Hunsaker David B
Current Estimated Value
Home Financials for this Owner
Home Financials are based on the most recent Mortgage that was taken out on this home.
Original Mortgage
$19,868
Outstanding Balance
$6,330
Interest Rate
5.76%
Mortgage Type
Unknown
Estimated Equity
$406,193
Purchase Details
Closed on
Sep 4, 2002
Sold by
Mark Higley Construction Lc
Bought by
Contreras Manuel M and Medrano Karla S
Home Financials for this Owner
Home Financials are based on the most recent Mortgage that was taken out on this home.
Original Mortgage
$108,398
Interest Rate
6.29%
Mortgage Type
FHA
Purchase Details
Closed on
Apr 24, 2002
Sold by
Mark Higley Inc
Bought by
Mark Higley Construction Lc
Home Financials for this Owner
Home Financials are based on the most recent Mortgage that was taken out on this home.
Original Mortgage
$88,080
Interest Rate
7.08%
Create a Home Valuation Report for This Property
The Home Valuation Report is an in-depth analysis detailing your home's value as well as a comparison with similar homes in the area
Home Values in the Area
Average Home Value in this Area
Purchase History
| Date | Buyer | Sale Price | Title Company |
|---|---|---|---|
| Hunsaker David B | -- | Equity Title Ins Agency Inc | |
| Contreras Manuel M | -- | Heritage West Title Insuranc | |
| Mark Higley Construction Lc | -- | Heritage West Title Insuranc |
Source: Public Records
Mortgage History
| Date | Status | Borrower | Loan Amount |
|---|---|---|---|
| Open | Hunsaker David B | $19,868 | |
| Open | Hunsaker David B | $99,342 | |
| Previous Owner | Contreras Manuel M | $108,398 | |
| Previous Owner | Mark Higley Construction Lc | $88,080 |
Source: Public Records
Tax History
| Year | Tax Paid | Tax Assessment Tax Assessment Total Assessment is a certain percentage of the fair market value that is determined by local assessors to be the total taxable value of land and additions on the property. | Land | Improvement |
|---|---|---|---|---|
| 2025 | $1,927 | $185,900 | $100,716 | $85,184 |
| 2024 | $1,886 | $183,149 | $74,682 | $108,467 |
| 2023 | $1,752 | $170,500 | $66,075 | $104,424 |
| 2022 | $1,865 | $329,000 | $103,420 | $225,580 |
| 2021 | $1,684 | $253,000 | $83,328 | $169,672 |
| 2020 | $1,492 | $217,000 | $63,738 | $153,262 |
| 2019 | $1,539 | $221,000 | $69,328 | $151,672 |
| 2018 | $1,369 | $195,000 | $68,599 | $126,401 |
| 2016 | $1,146 | $85,635 | $30,422 | $55,213 |
| 2015 | $1,094 | $77,825 | $30,422 | $47,403 |
| 2014 | $1,057 | $76,680 | $30,422 | $46,258 |
| 2013 | -- | $78,070 | $30,245 | $47,825 |
Source: Public Records
Map
Nearby Homes
- 3971 W 975 S
- 4068 W 1200 S
- 3867 Rungsted Cir
- 3736 W 1225 S
- 4193 W 1175 S
- 387 S 4250 W
- 4411 W 920 S Unit 111
- 3546 Brookshire Dr
- 1340 S 4125 W
- 396 S 4300 W
- 388 S 4300 W Unit 607
- 4260 W 350 S
- 372 S 4300 W Unit 609
- 364 S 4300 W Unit 610
- 1068 S 4425 W
- 1157 S 4425 W
- 356 S 4300 W Unit 611
- 536 S Thurgood Ln
- 964 S 4475 W Unit 123
- 982 S 4475 W Unit 122
Your Personal Tour Guide
Ask me questions while you tour the home.