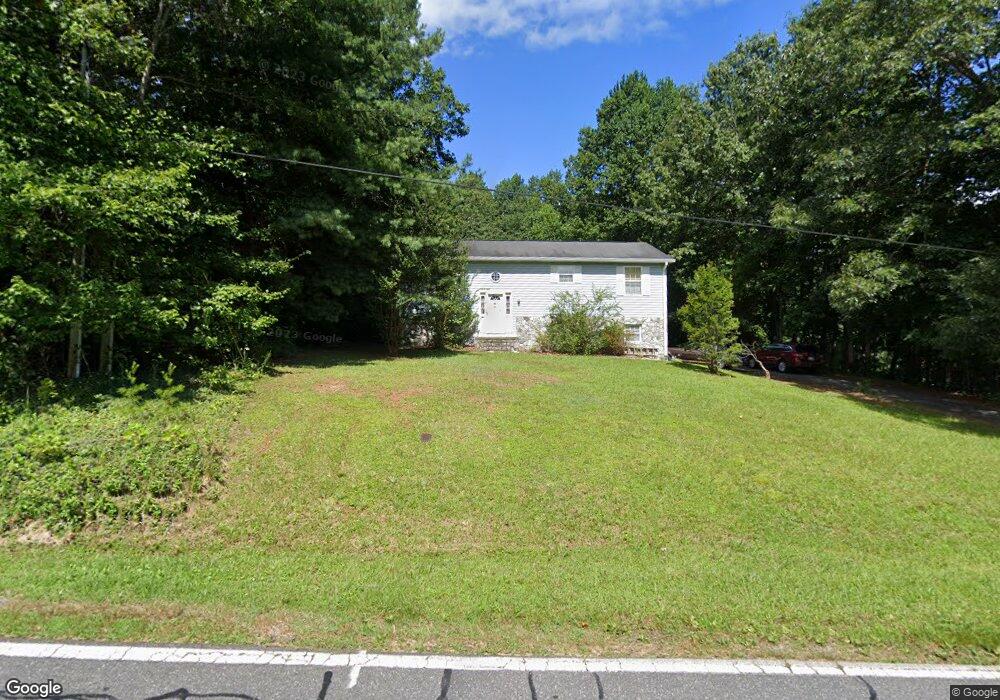
3836 Frank Whisnant Rd Morganton, NC 28655
Estimated Value: $248,000 - $309,000
3
Beds
2
Baths
1,531
Sq Ft
$184/Sq Ft
Est. Value
About This Home
This home is located at 3836 Frank Whisnant Rd, Morganton, NC 28655 and is currently estimated at $281,568, approximately $183 per square foot. 3836 Frank Whisnant Rd is a home located in Burke County with nearby schools including Oak Hill Elementary School, Table Rock Middle School, and Freedom High School.
Ownership History
Date
Name
Owned For
Owner Type
Purchase Details
Closed on
Aug 10, 2021
Sold by
Jones Amanda L
Bought by
Jones Michael S
Current Estimated Value
Purchase Details
Closed on
Sep 18, 2009
Sold by
Foster Kristina A
Bought by
Jones Michael S
Home Financials for this Owner
Home Financials are based on the most recent Mortgage that was taken out on this home.
Original Mortgage
$121,605
Interest Rate
5.15%
Mortgage Type
New Conventional
Purchase Details
Closed on
Oct 19, 2007
Sold by
Kramer Leon
Bought by
Jones Michael S and Foster Kristina A
Home Financials for this Owner
Home Financials are based on the most recent Mortgage that was taken out on this home.
Original Mortgage
$122,400
Interest Rate
6.27%
Mortgage Type
New Conventional
Create a Home Valuation Report for This Property
The Home Valuation Report is an in-depth analysis detailing your home's value as well as a comparison with similar homes in the area
Home Values in the Area
Average Home Value in this Area
Purchase History
| Date | Buyer | Sale Price | Title Company |
|---|---|---|---|
| Jones Michael S | -- | None Listed On Document | |
| Jones Michael S | -- | None Available | |
| Jones Michael S | $120,000 | None Available |
Source: Public Records
Mortgage History
| Date | Status | Borrower | Loan Amount |
|---|---|---|---|
| Previous Owner | Jones Michael S | $121,605 | |
| Previous Owner | Jones Michael S | $122,400 |
Source: Public Records
Tax History Compared to Growth
Tax History
| Year | Tax Paid | Tax Assessment Tax Assessment Total Assessment is a certain percentage of the fair market value that is determined by local assessors to be the total taxable value of land and additions on the property. | Land | Improvement |
|---|---|---|---|---|
| 2025 | $1,030 | $147,640 | $13,871 | $133,769 |
| 2024 | $1,033 | $147,640 | $13,871 | $133,769 |
| 2023 | $1,033 | $147,640 | $13,871 | $133,769 |
| 2022 | $995 | $116,308 | $13,871 | $102,437 |
| 2021 | $989 | $116,308 | $13,871 | $102,437 |
| 2020 | $985 | $116,308 | $13,871 | $102,437 |
| 2019 | $985 | $116,308 | $13,871 | $102,437 |
| 2018 | $898 | $105,195 | $13,871 | $91,324 |
| 2017 | $896 | $105,195 | $13,871 | $91,324 |
| 2016 | $875 | $105,195 | $13,871 | $91,324 |
| 2015 | $872 | $105,195 | $13,871 | $91,324 |
| 2014 | $871 | $105,195 | $13,871 | $91,324 |
| 2013 | $860 | $105,195 | $13,871 | $91,324 |
Source: Public Records
Map
Nearby Homes
- 3666 Grandview Dr
- 3680 Grandview Dr
- 2556 Nc 126
- 3026 Coventry Dr
- 2937 Frank Whisnant Rd
- 2401 Nc 181
- 3375 Nc 126
- 1060 Hawksbill Dr
- 130 Hawksbill Dr Unit 47
- 2482 Paddock Cir
- 2151 River Bend Ln
- 3620 Lake Dr
- 807 N Carolina 126
- 3494 Lake Dr Unit 17
- 3639 Lake Dr Unit 25
- 0 Boyd Moore Ave Unit CAR3848175
- 3577 Lake Dr Unit 26
- 3486 Lake Dr Unit 16
- 4625 Boyd Moore Ave
- 2040 River Bend Ln
- 3826 Frank Whisnant Rd
- 3848 Frank Whisnant Rd
- 3858 Frank Whisnant Rd
- 3810 Frank Whisnant Rd
- 3845 Frank Whisnant Rd
- 3861 Frank Whisnant Rd
- 3825 Frank Whisnant Rd
- 3800 Frank Whisnant Rd
- 3875 Frank Whisnant Rd
- 3815 Frank Whisnant Rd
- 3790 Frank Whisnant Rd
- 3888 Frank Whisnant Rd
- 3885 Frank Whisnant Rd
- 3780 Frank Whisnant Rd
- 3897 Frank Whisnant Rd
- 3664 Bluebird Farm Rd
- 3770 Frank Whisnant Rd
- 3903 Frank Whisnant Rd
- 3785 Frank Whisnant Rd
- 3605 Grandview Dr