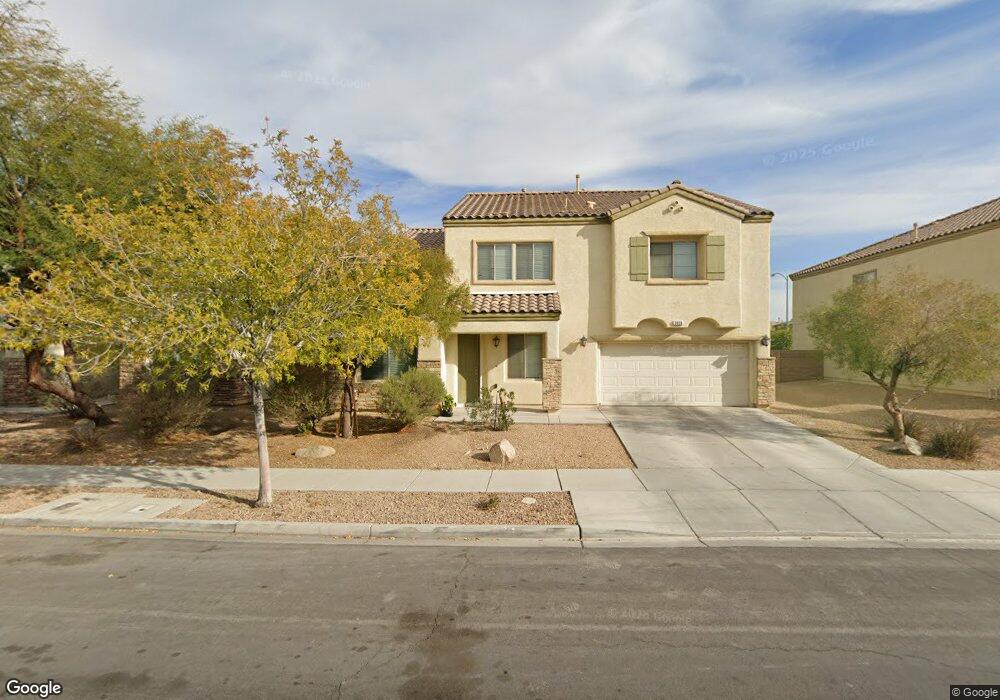
3836 Fuselier Dr Unit 6 North Las Vegas, NV 89032
Cheyenne NeighborhoodEstimated Value: $486,965 - $529,000
4
Beds
4
Baths
2,946
Sq Ft
$174/Sq Ft
Est. Value
About This Home
This home is located at 3836 Fuselier Dr Unit 6, North Las Vegas, NV 89032 and is currently estimated at $513,241, approximately $174 per square foot. 3836 Fuselier Dr Unit 6 is a home located in Clark County with nearby schools including Richard C. Priest Elementary School, Theron L Swainston Middle School, and Cheyenne High School.
Ownership History
Date
Name
Owned For
Owner Type
Purchase Details
Closed on
Jun 8, 2011
Sold by
Secretary Of Housing & Urban Development
Bought by
Srikaew Boonyang and Srikaew Somrak
Current Estimated Value
Home Financials for this Owner
Home Financials are based on the most recent Mortgage that was taken out on this home.
Original Mortgage
$135,441
Outstanding Balance
$93,894
Interest Rate
4.75%
Mortgage Type
FHA
Estimated Equity
$419,347
Purchase Details
Closed on
Jul 9, 2010
Sold by
Smith Tippy R
Bought by
Wells Fargo Bank Na
Purchase Details
Closed on
Mar 27, 2008
Sold by
Centex Homes
Bought by
Smith Tippy R
Home Financials for this Owner
Home Financials are based on the most recent Mortgage that was taken out on this home.
Original Mortgage
$285,554
Interest Rate
5.72%
Mortgage Type
FHA
Create a Home Valuation Report for This Property
The Home Valuation Report is an in-depth analysis detailing your home's value as well as a comparison with similar homes in the area
Home Values in the Area
Average Home Value in this Area
Purchase History
| Date | Buyer | Sale Price | Title Company |
|---|---|---|---|
| Srikaew Boonyang | $147,600 | Nevada Title Las Vegas | |
| Wells Fargo Bank Na | $309,863 | Fidelity National Default S | |
| Secretary Of Housing & Urban Development | $309,863 | Fidelity National Default S | |
| Smith Tippy R | $290,036 | Commerce Title |
Source: Public Records
Mortgage History
| Date | Status | Borrower | Loan Amount |
|---|---|---|---|
| Open | Srikaew Boonyang | $135,441 | |
| Previous Owner | Smith Tippy R | $285,554 |
Source: Public Records
Tax History Compared to Growth
Tax History
| Year | Tax Paid | Tax Assessment Tax Assessment Total Assessment is a certain percentage of the fair market value that is determined by local assessors to be the total taxable value of land and additions on the property. | Land | Improvement |
|---|---|---|---|---|
| 2025 | $2,991 | $156,722 | $36,400 | $120,322 |
| 2024 | $2,770 | $156,722 | $36,400 | $120,322 |
| 2023 | $1,845 | $159,530 | $36,400 | $123,130 |
| 2022 | $2,565 | $129,136 | $29,400 | $99,736 |
| 2021 | $2,376 | $115,427 | $26,250 | $89,177 |
| 2020 | $2,203 | $110,474 | $25,550 | $84,924 |
| 2019 | $2,065 | $100,462 | $23,100 | $77,362 |
| 2018 | $1,970 | $97,168 | $20,300 | $76,868 |
| 2017 | $3,032 | $90,390 | $18,550 | $71,840 |
| 2016 | $1,845 | $82,325 | $11,550 | $70,775 |
| 2015 | $1,841 | $60,391 | $7,000 | $53,391 |
| 2014 | $1,783 | $51,578 | $7,000 | $44,578 |
Source: Public Records
Map
Nearby Homes
- 2409 W Gilmore Ave
- 3736 Coleman St
- 3609 Simmons St
- 3712 Blairmoor St
- 3107 Atwater Dr
- 0 Simmons & Logan Unit 2721829
- 2801 Simmons Creek Ct
- 2124 Cabrini Ct
- 0 Simmons & Logan 2 Unit 2722091
- 0 Simmons & Logan 3 Unit 2722103
- 3834 W Gowan Rd
- Bellevue NextGen Plan at Simmance
- Skyland Plan at Simmance
- 3910 Cheryl Clay Way
- 410 Rocky Peak Dr Unit 1704
- 3524 Simmons St
- 3841 Intermezzo Way
- 2906 Carothers Ct
- 3804 Debussy Way
- 3556 Valley Lily St
- 2524 Endearing Ct
- 3832 Fuselier Dr
- 3840 Fuselier Dr Unit 6
- 3828 Fuselier Dr
- 2520 Endearing Ct
- 2609 Jubilance Point Ct
- 2605 Jubilance Point Ct
- 3841 Fuselier Dr
- 3837 Fuselier Dr
- 2523 Endearing Ct
- 3845 Fuselier Dr
- 2521 Jubilance Point Ct
- 3833 Fuselier Dr
- 2516 Endearing Ct
- 3824 Fuselier Dr
- 3905 Fuselier Dr
- 2519 Endearing Ct
- 3829 Fuselier Dr
- 2517 Jubilance Point Ct
- 2512 Endearing Ct