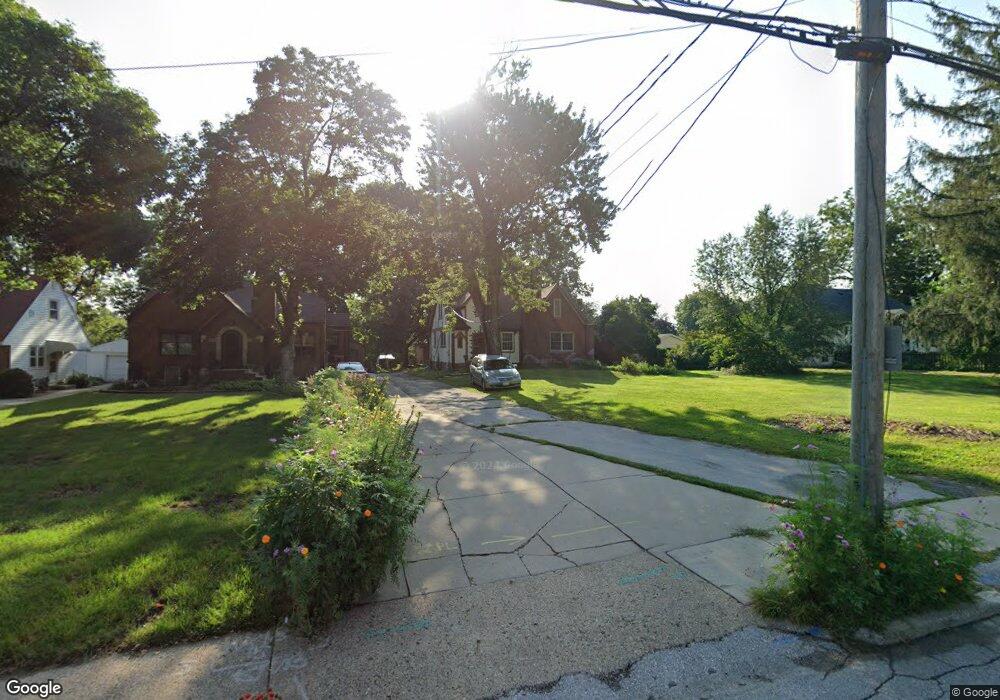
3837 Beaver Ave Des Moines, IA 50310
Lower Beaver NeighborhoodEstimated Value: $325,000 - $361,074
2
Beds
2
Baths
1,999
Sq Ft
$171/Sq Ft
Est. Value
About This Home
This home is located at 3837 Beaver Ave, Des Moines, IA 50310 and is currently estimated at $341,019, approximately $170 per square foot. 3837 Beaver Ave is a home located in Polk County with nearby schools including Samuelson Elementary School, Meredith Middle School, and Hoover High School.
Ownership History
Date
Name
Owned For
Owner Type
Purchase Details
Closed on
Feb 25, 2016
Sold by
Whitlock Katherine Mae and Graham Katherine Mae
Bought by
Graham Douglas D
Current Estimated Value
Home Financials for this Owner
Home Financials are based on the most recent Mortgage that was taken out on this home.
Original Mortgage
$137,425
Outstanding Balance
$108,764
Interest Rate
3.73%
Mortgage Type
New Conventional
Estimated Equity
$232,255
Purchase Details
Closed on
May 8, 2002
Sold by
Shimon James Howard and Shimon Kristal Ann
Bought by
Graham Douglas D and Graham Katie Mae
Home Financials for this Owner
Home Financials are based on the most recent Mortgage that was taken out on this home.
Original Mortgage
$146,775
Interest Rate
7.07%
Create a Home Valuation Report for This Property
The Home Valuation Report is an in-depth analysis detailing your home's value as well as a comparison with similar homes in the area
Home Values in the Area
Average Home Value in this Area
Purchase History
We collect this data history from publicly available records. To have your information removed, we recommend requesting removal directly through your county’s website.
| Date | Buyer | Sale Price | Title Company |
|---|---|---|---|
| Graham Douglas D | -- | None Available | |
| Graham Douglas D | $154,000 | -- |
Source: Public Records
Mortgage History
We collect this data history from publicly available records. To have your information removed, we recommend requesting removal directly through your county’s website.
| Date | Status | Borrower | Loan Amount |
|---|---|---|---|
| Open | Graham Douglas D | $137,425 | |
| Closed | Graham Douglas D | $146,775 |
Source: Public Records
Tax History
| Year | Tax Paid | Tax Assessment Tax Assessment Total Assessment is a certain percentage of the fair market value that is determined by local assessors to be the total taxable value of land and additions on the property. | Land | Improvement |
|---|---|---|---|---|
| 2025 | $6,132 | $354,600 | $64,400 | $290,200 |
| 2024 | $6,132 | $322,200 | $57,400 | $264,800 |
| 2023 | $5,916 | $322,200 | $57,400 | $264,800 |
| 2022 | $5,870 | $259,900 | $47,900 | $212,000 |
| 2021 | $5,970 | $259,900 | $47,900 | $212,000 |
| 2020 | $6,196 | $247,800 | $45,600 | $202,200 |
| 2019 | $5,788 | $247,800 | $45,600 | $202,200 |
| 2018 | $5,724 | $223,900 | $40,400 | $183,500 |
| 2017 | $5,108 | $223,900 | $40,400 | $183,500 |
| 2016 | $4,972 | $197,400 | $35,100 | $162,300 |
| 2015 | $4,972 | $197,400 | $35,100 | $162,300 |
| 2014 | $4,952 | $195,100 | $34,000 | $161,100 |
Source: Public Records
Map
Nearby Homes
Your Personal Tour Guide
Ask me questions while you tour the home.