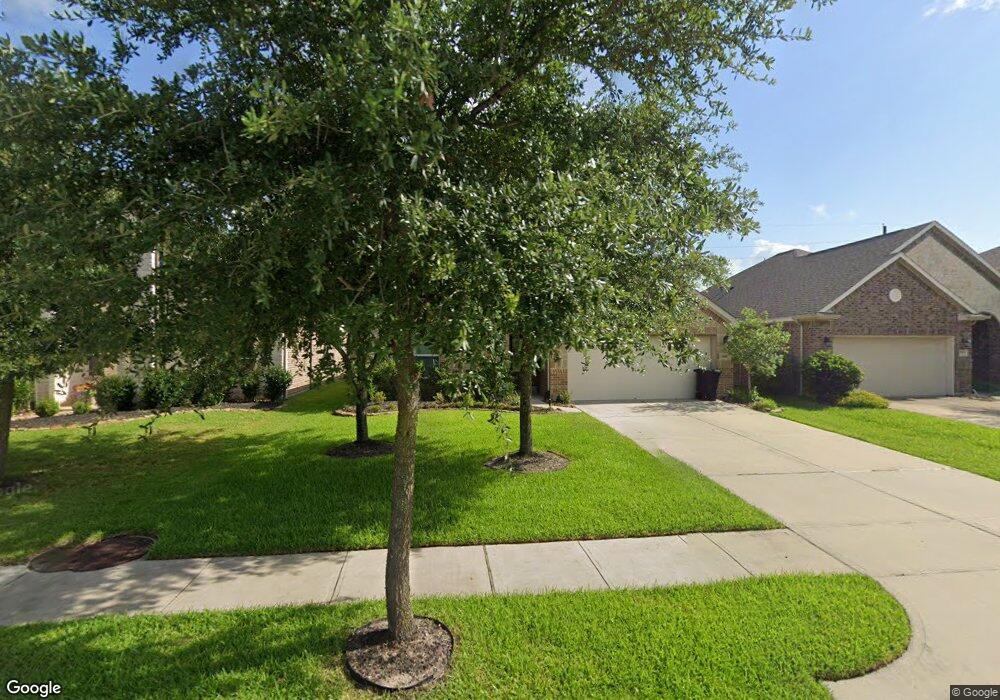
3837 Enchanted Timbers Ln Spring, TX 77386
Imperial Oaks NeighborhoodEstimated Value: $361,000 - $386,000
4
Beds
2
Baths
2,080
Sq Ft
$178/Sq Ft
Est. Value
About This Home
This home is located at 3837 Enchanted Timbers Ln, Spring, TX 77386 and is currently estimated at $371,087, approximately $178 per square foot. 3837 Enchanted Timbers Ln is a home located in Montgomery County with nearby schools including Bradley Elementary School, York J High School, and Grand Oaks High School.
Ownership History
Date
Name
Owned For
Owner Type
Purchase Details
Closed on
Nov 8, 2019
Sold by
Grandjean Cole and Bracknell Alexis
Bought by
Pomerleau Michael C and Pomerleau Amy M
Current Estimated Value
Home Financials for this Owner
Home Financials are based on the most recent Mortgage that was taken out on this home.
Original Mortgage
$260,200
Outstanding Balance
$228,909
Interest Rate
3.6%
Mortgage Type
FHA
Estimated Equity
$142,178
Purchase Details
Closed on
Sep 21, 2015
Sold by
Lennar Homes Of Texas Sales & Marketing
Bought by
Grandjean Cole and Bracknell Alexis
Home Financials for this Owner
Home Financials are based on the most recent Mortgage that was taken out on this home.
Original Mortgage
$225,872
Interest Rate
3.99%
Mortgage Type
FHA
Purchase Details
Closed on
May 15, 2015
Sold by
Imperial Promenade Inc
Bought by
Grandjean Cole and Alexis Bracknell
Create a Home Valuation Report for This Property
The Home Valuation Report is an in-depth analysis detailing your home's value as well as a comparison with similar homes in the area
Home Values in the Area
Average Home Value in this Area
Purchase History
| Date | Buyer | Sale Price | Title Company |
|---|---|---|---|
| Pomerleau Michael C | -- | First American Title | |
| Grandjean Cole | -- | Nat | |
| Lennar Homes Of Texas Sales & Marketing | -- | North American Title Company | |
| Grandjean Cole | -- | -- |
Source: Public Records
Mortgage History
| Date | Status | Borrower | Loan Amount |
|---|---|---|---|
| Open | Pomerleau Michael C | $260,200 | |
| Previous Owner | Grandjean Cole | $225,872 |
Source: Public Records
Tax History Compared to Growth
Tax History
| Year | Tax Paid | Tax Assessment Tax Assessment Total Assessment is a certain percentage of the fair market value that is determined by local assessors to be the total taxable value of land and additions on the property. | Land | Improvement |
|---|---|---|---|---|
| 2025 | $8,995 | $375,201 | $75,000 | $300,201 |
| 2024 | $8,074 | $351,912 | -- | -- |
| 2023 | $8,074 | $319,920 | $75,000 | $303,160 |
| 2022 | $10,085 | $326,880 | $26,490 | $300,390 |
| 2021 | $8,457 | $264,400 | $26,490 | $237,910 |
| 2020 | $8,440 | $256,200 | $26,490 | $229,710 |
| 2019 | $8,601 | $255,640 | $26,490 | $229,530 |
| 2018 | $7,225 | $232,400 | $26,490 | $205,910 |
| 2017 | $7,812 | $232,400 | $26,490 | $205,910 |
| 2016 | $7,359 | $218,900 | $26,490 | $192,410 |
Source: Public Records
Map
Nearby Homes
- 31201 Redwood Manor Ct
- 3914 Quiet Pines Ct
- 31268 New Forest Park Ln
- 3864 Oakmist Bend Ln
- 31144 Aspen Gate Trail
- 3734 Prelude Springs Ln
- 3919 Dorothy Oaks Ct
- 3663 Cottage Pines Ln
- 31013 Sunfall Trail Ln
- 28894 Llano River Loop
- 3604 Magnolia Crest Ln
- 31765 Twin Timbers Ln
- 3523 Tulip Trace Dr
- 30802 Lavender Trace Dr
- 29871 Woodsons Edge Way
- 29887 Woodsons Edge Way
- 3124 Dunsmore Manor Ct
- 30742 Gardenia Trace Dr
- 30507 Woodson Trace Dr
- 29897 Dovetail Bluff Ln
- 3841 Enchanted Timbers Ln
- 3833 Enchanted Timbers Ln
- 3845 Enchanted Timbers Ln
- 3829 Enchanted Timbers Ln
- 3837 Juniper Meadows Ln
- 3833 Juniper Meadows Ln
- 3825 Enchanted Timbers Ln
- 3849 Enchanted Timbers Ln
- 3841 Juniper Meadows Ln
- 3829 Juniper Meadows Ln
- 3834 Enchanted Timbers Ln
- 3846 Enchanted Timbers Ln
- 3838 Enchanted Timbers Ln
- 3845 Juniper Meadows Ln
- 3825 Juniper Meadows Ln
- 3853 Enchanted Timbers Ln
- 3842 Enchanted Timbers Ln
- 3830 Enchanted Timbers Ln
- 3821 Enchanted Timbers Ln
- 3826 Enchanted Timbers Ln