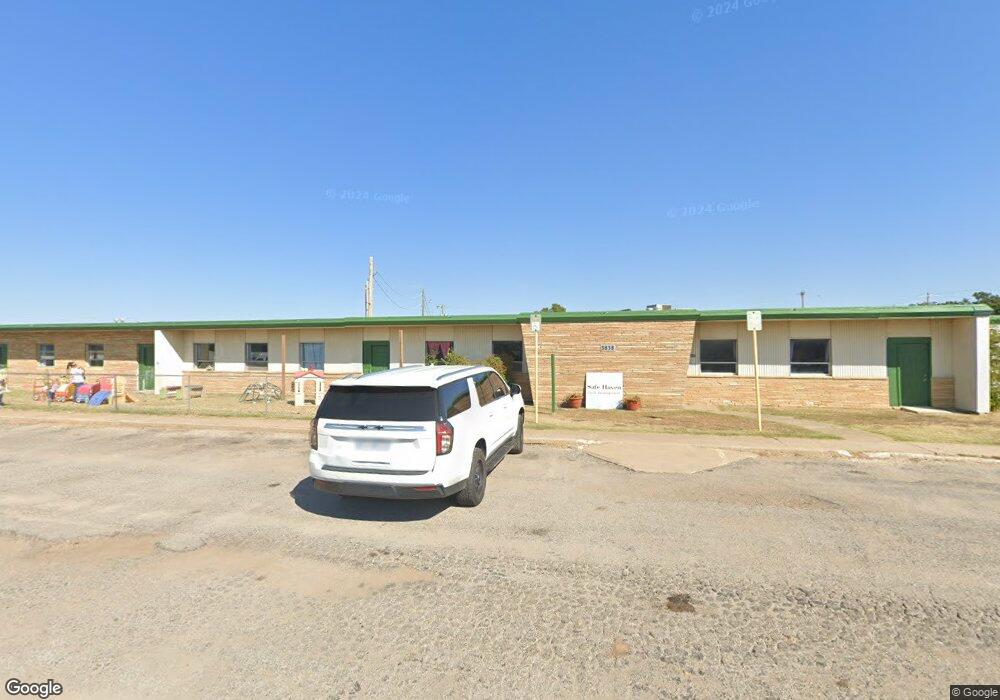
3838 State St Bartlesville, OK 74006
Estimated Value: $293,238
--
Bed
--
Bath
12,737
Sq Ft
$23/Sq Ft
Est. Value
About This Home
This home is located at 3838 State St, Bartlesville, OK 74006 and is currently estimated at $293,238, approximately $23 per square foot. 3838 State St is a home located in Washington County with nearby schools including Hoover Elementary School, Madison Middle School, and Bartlesville High School.
Ownership History
Date
Name
Owned For
Owner Type
Purchase Details
Closed on
Jun 13, 2023
Sold by
Wells Robbin L
Bought by
Ce Property Management Llc
Current Estimated Value
Home Financials for this Owner
Home Financials are based on the most recent Mortgage that was taken out on this home.
Original Mortgage
$216,000
Outstanding Balance
$123,717
Interest Rate
6.39%
Mortgage Type
Credit Line Revolving
Estimated Equity
$169,521
Purchase Details
Closed on
Jan 25, 2012
Sold by
Wells Sean G
Bought by
Wells Robbin L
Purchase Details
Closed on
May 27, 2010
Sold by
3838 State Street Llc
Bought by
Wells Sean G
Home Financials for this Owner
Home Financials are based on the most recent Mortgage that was taken out on this home.
Original Mortgage
$152,000
Interest Rate
5.02%
Mortgage Type
Commercial
Purchase Details
Closed on
May 27, 1997
Sold by
Vogt Halene T
Purchase Details
Closed on
Jul 12, 1993
Sold by
Vogt Thomas L and Vogt Halene T
Create a Home Valuation Report for This Property
The Home Valuation Report is an in-depth analysis detailing your home's value as well as a comparison with similar homes in the area
Home Values in the Area
Average Home Value in this Area
Purchase History
| Date | Buyer | Sale Price | Title Company |
|---|---|---|---|
| Ce Property Management Llc | $270,000 | Apex Title | |
| Wells Robbin L | -- | None Available | |
| Wells Sean G | $190,000 | -- | |
| -- | -- | -- | |
| -- | -- | -- |
Source: Public Records
Mortgage History
| Date | Status | Borrower | Loan Amount |
|---|---|---|---|
| Open | Ce Property Management Llc | $216,000 | |
| Previous Owner | Wells Sean G | $152,000 |
Source: Public Records
Tax History Compared to Growth
Tax History
| Year | Tax Paid | Tax Assessment Tax Assessment Total Assessment is a certain percentage of the fair market value that is determined by local assessors to be the total taxable value of land and additions on the property. | Land | Improvement |
|---|---|---|---|---|
| 2025 | $3,922 | $31,602 | $12,285 | $19,317 |
| 2024 | $3,922 | $32,657 | $12,285 | $20,372 |
| 2023 | $3,922 | $29,278 | $7,372 | $21,906 |
| 2022 | $3,507 | $29,278 | $7,372 | $21,906 |
| 2021 | $3,439 | $29,278 | $7,372 | $21,906 |
| 2020 | $3,515 | $29,278 | $7,372 | $21,906 |
| 2019 | $3,517 | $29,278 | $7,372 | $21,906 |
| 2018 | $3,500 | $29,278 | $7,372 | $21,906 |
| 2017 | $3,581 | $29,278 | $7,372 | $21,906 |
| 2016 | $3,361 | $29,278 | $7,372 | $21,906 |
| 2015 | $3,401 | $29,278 | $7,372 | $21,906 |
| 2014 | $3,444 | $29,278 | $7,372 | $21,906 |
Source: Public Records
Map
Nearby Homes
- 300 SE Waverly Ave
- 328 SE Waverly Ave
- 136 SE Debell Ave
- 202 Bradley Place
- 366 SE Wilshire Ave
- 220 SE Roselawn Ave
- 4212 Michigan St
- 4513 Tuxedo Blvd
- 3317 Tuxedo Blvd Unit B
- 313 S Fenway Place
- 4600 Cara Lee Ln
- 397 Fleetwood Dr
- 4507 E Frank Phillips Blvd
- 305 NE Myers Ave
- 0 SE Adams Rd Unit 2541155
- 404 NE Avondale Ave
- 633 Kenwood Dr
- 4816 Carole Ct
- 355 Robin Ave
- 208 NE Spruce Ave
- 236 SE Avondale Ave
- 3900 State St
- 232 SE Avondale Ave
- 228 SE Avondale Ave
- 305 SE Avondale Ave
- 222 SE Avondale Ave
- 201 SE Avondale Ave
- 4008 State St
- 309 SE Avondale Ave
- 231 SE Queenstown Ave
- 229 SE Queenstown Ave
- 227 SE Queenstown Ave
- 4003 State St
- 212 SE Avondale Ave
- 3801 SE Kentucky St
- 226 SE Washington Blvd
- 221 SE Queenstown Ave
- 204 SE Washington Blvd
- 206 SE Avondale Ave
- 211 SE Queenstown Ave