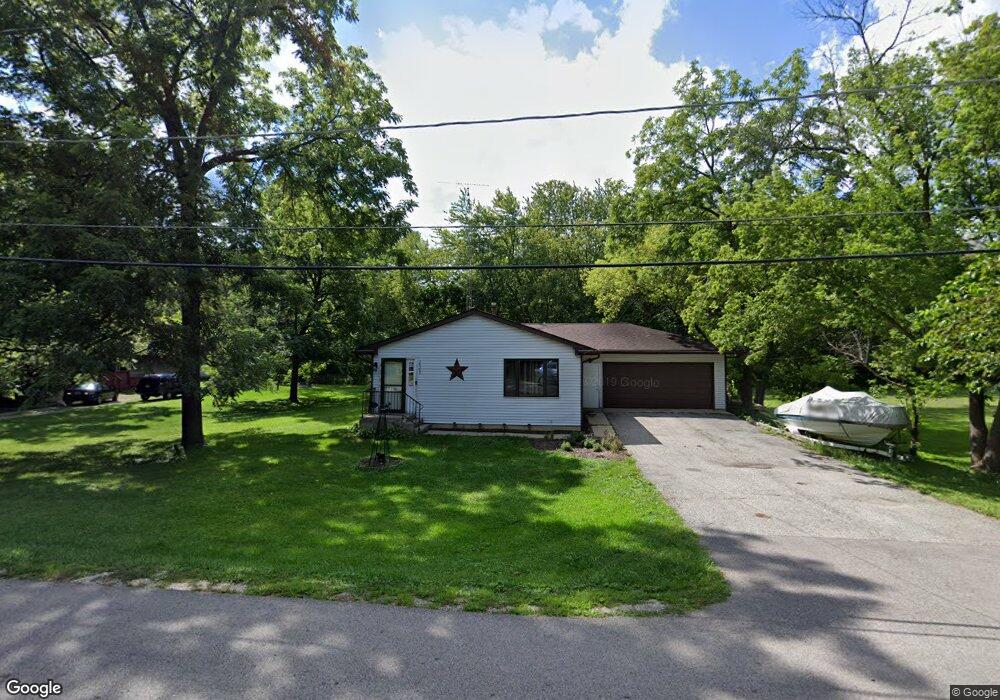
38382 N 6th Ave Spring Grove, IL 60081
Northeast Fox Lake NeighborhoodEstimated Value: $211,000 - $247,000
3
Beds
1
Bath
1,100
Sq Ft
$207/Sq Ft
Est. Value
About This Home
This home is located at 38382 N 6th Ave, Spring Grove, IL 60081 and is currently estimated at $227,415, approximately $206 per square foot. 38382 N 6th Ave is a home located in Lake County with nearby schools including Lotus Elementary School, Stanton Middle School, and Grant Community High School.
Ownership History
Date
Name
Owned For
Owner Type
Purchase Details
Closed on
Aug 3, 2019
Sold by
Landwer William E
Bought by
Landwer William E and Landwer Brittany C
Current Estimated Value
Home Financials for this Owner
Home Financials are based on the most recent Mortgage that was taken out on this home.
Original Mortgage
$130,300
Outstanding Balance
$84,370
Interest Rate
3.6%
Mortgage Type
New Conventional
Estimated Equity
$143,045
Purchase Details
Closed on
Apr 24, 2009
Sold by
Disilvestro Mark A and Disilvestro Gary F
Bought by
Landwer William E
Home Financials for this Owner
Home Financials are based on the most recent Mortgage that was taken out on this home.
Original Mortgage
$110,953
Interest Rate
4.85%
Mortgage Type
FHA
Purchase Details
Closed on
Nov 24, 2008
Sold by
Disilvestro Phyllis
Bought by
Disilvestro Mark A and Disilvestro Gary F
Purchase Details
Closed on
Aug 15, 1994
Sold by
Disilvestro Phyllis
Bought by
Disilvestro Phyllis
Create a Home Valuation Report for This Property
The Home Valuation Report is an in-depth analysis detailing your home's value as well as a comparison with similar homes in the area
Home Values in the Area
Average Home Value in this Area
Purchase History
| Date | Buyer | Sale Price | Title Company |
|---|---|---|---|
| Landwer William E | -- | Citywide Title Corporation | |
| Landwer William E | $113,000 | Real Property Title Llc | |
| Disilvestro Mark A | -- | None Available | |
| Disilvestro Phyllis | -- | -- |
Source: Public Records
Mortgage History
| Date | Status | Borrower | Loan Amount |
|---|---|---|---|
| Open | Landwer William E | $130,300 | |
| Closed | Landwer William E | $110,953 |
Source: Public Records
Tax History
| Year | Tax Paid | Tax Assessment Tax Assessment Total Assessment is a certain percentage of the fair market value that is determined by local assessors to be the total taxable value of land and additions on the property. | Land | Improvement |
|---|---|---|---|---|
| 2024 | $3,818 | $62,186 | $2,852 | $59,334 |
| 2023 | $3,205 | $55,683 | $2,554 | $53,129 |
| 2022 | $3,205 | $44,671 | $3,179 | $41,492 |
| 2021 | $3,044 | $41,682 | $2,966 | $38,716 |
| 2020 | $2,983 | $40,531 | $2,884 | $37,647 |
| 2019 | $2,803 | $38,760 | $2,758 | $36,002 |
| 2018 | $2,791 | $38,045 | $2,792 | $35,253 |
| 2017 | $2,753 | $36,213 | $2,658 | $33,555 |
| 2016 | $2,925 | $34,948 | $2,565 | $32,383 |
| 2015 | $2,938 | $34,059 | $2,500 | $31,559 |
| 2014 | $3,295 | $38,660 | $3,730 | $34,930 |
| 2012 | $3,309 | $40,498 | $3,730 | $36,768 |
Source: Public Records
Map
Nearby Homes
- 38480 N 6th Ave
- 38227 N 3rd Ave
- 27849 W Lake Shore Dr
- 27580 W Stonegate Dr
- 27771 W Lake Shore Dr
- 27726 Hill Dr
- 28624 W Kendall Ave
- 7105 Saint Tropez Ct Unit 297
- 8226 Cinnamon Ln Unit H4D
- 8300 Reva Bay Ln Unit SLIP4
- 8300 Reva Bay Ln Unit SLIP5
- 39175 NW End Dr
- Lots 11 & 12 W Ravine Dr
- Lots 8 & 9 W Ravine Dr
- 7205 Hastings Cir Unit 330
- 39091 N Mound Ave
- 39080 N Jackson Dr
- 7302 Chevy Chase Ct Unit 51
- 63 Aspen Colony Unit 8
- 40 Bermuda Colony Unit 7
- 38398 N 6th Ave
- 38366 N 6th Ave
- 38412 N 6th Ave
- 38407 N 7th Ave
- 38381 N 6th Ave
- 38415 N 7th Ave
- 38338 N 6th Ave
- 38417 N 6th Ave
- 38434 N 6th Ave
- 38315 N 6th Ave
- 38330 N 6th Ave
- 38425 N 6th Ave
- 38442 N 6th Ave
- 38337 N 6th Ave
- 38331 N 7th Ave
- 38382 N 7th Ave
- 27930 W Rowe Ave
- 38323 N 7th Ave
- 38416 N 8th St
- 38416 N 7th Ave
Your Personal Tour Guide
Ask me questions while you tour the home.