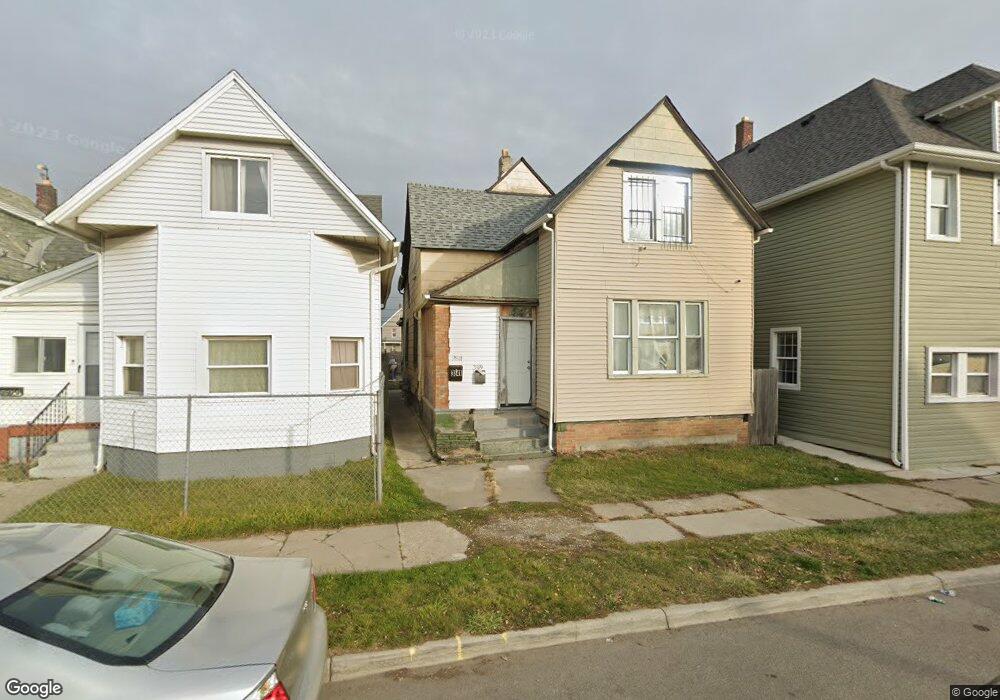
3839 Dorothy St HamtraMcK, MI 48211
Estimated Value: $86,000 - $286,000
4
Beds
2
Baths
1,600
Sq Ft
$138/Sq Ft
Est. Value
About This Home
This home is located at 3839 Dorothy St, HamtraMcK, MI 48211 and is currently estimated at $220,774, approximately $137 per square foot. 3839 Dorothy St is a home located in Wayne County with nearby schools including Holbrook Elementary School, Kosciuszko Middle School, and Hamtramck High School.
Ownership History
Date
Name
Owned For
Owner Type
Purchase Details
Closed on
Mar 15, 2021
Sold by
Aihariri Mohamed M
Bought by
Aihariri Adam M
Current Estimated Value
Purchase Details
Closed on
Apr 1, 2014
Sold by
Alhariri Mohamed Ahmed and Alhariri Fouad Mohamed
Bought by
Alhariri Mohamed M
Purchase Details
Closed on
Sep 17, 2013
Sold by
Musleh Yazan A and Musleh Huda M
Bought by
Alhariri Mohamed Ahmed
Purchase Details
Closed on
Dec 31, 2008
Sold by
Us Bank National Association
Bought by
Musleh Yazan
Purchase Details
Closed on
Apr 17, 2008
Sold by
Fransou Friyal
Bought by
Us Bank Na and Asset Backed Pass Through Certificates S
Purchase Details
Closed on
Jul 6, 2006
Sold by
Khan Nurul and Begum Bilquis
Bought by
Fransou Firyal
Home Financials for this Owner
Home Financials are based on the most recent Mortgage that was taken out on this home.
Original Mortgage
$89,910
Interest Rate
9.99%
Mortgage Type
Purchase Money Mortgage
Create a Home Valuation Report for This Property
The Home Valuation Report is an in-depth analysis detailing your home's value as well as a comparison with similar homes in the area
Home Values in the Area
Average Home Value in this Area
Purchase History
| Date | Buyer | Sale Price | Title Company |
|---|---|---|---|
| Aihariri Adam M | -- | None Available | |
| Alhariri Mohamed M | -- | None Available | |
| Alhariri Mohamed Ahmed | $10,000 | None Available | |
| Musleh Yazan | $6,500 | Attorneys Title Agency Llc | |
| Us Bank Na | $22,400 | None Available | |
| Fransou Firyal | $99,900 | General Title |
Source: Public Records
Mortgage History
| Date | Status | Borrower | Loan Amount |
|---|---|---|---|
| Previous Owner | Fransou Firyal | $89,910 |
Source: Public Records
Tax History
| Year | Tax Paid | Tax Assessment Tax Assessment Total Assessment is a certain percentage of the fair market value that is determined by local assessors to be the total taxable value of land and additions on the property. | Land | Improvement |
|---|---|---|---|---|
| 2025 | $1,095 | $95,700 | $0 | $0 |
| 2024 | $897 | $84,200 | $0 | $0 |
| 2023 | $1,038 | $72,000 | $0 | $0 |
| 2022 | $889 | $57,100 | $0 | $0 |
| 2021 | $1,007 | $47,200 | $0 | $0 |
| 2020 | $999 | $39,600 | $0 | $0 |
| 2019 | $991 | $30,500 | $0 | $0 |
| 2018 | $759 | $26,300 | $0 | $0 |
| 2017 | $410 | $18,300 | $0 | $0 |
| 2016 | $938 | $16,500 | $0 | $0 |
| 2015 | $1,620 | $16,200 | $0 | $0 |
| 2013 | $1,660 | $16,600 | $0 | $0 |
| 2012 | $1,263 | $18,500 | $2,100 | $16,400 |
Source: Public Records
Map
Nearby Homes
- 4027 Oliver St
- 8421 Mount Elliott St
- 3170 Jacob St
- 3219 Hanley St
- 3376 Holbrook St
- 7824 Mount Elliott St
- 3057 Jacob St
- 3017 Jacob St
- 3828 Doremus St
- 2946 Goodson St
- 3321 Holbrook St
- 8820 Joseph Campau St Unit 3
- 3321 Doremus St
- 3360 Norwalk St
- 2455 Andrus St
- 2436 Hewitt St
- 3368 Evaline St
- 5013 Evaline St
- 2285 Alice St
- 8312 Conant St
- 3833 Dorothy St
- 3827 Dorothy St
- 3855 Dorothy St
- 3857 Dorothy St
- 3849 Dorothy St
- 3864 Oliver St
- 3848 Oliver St
- 3869 Dorothy St
- 3876 Oliver St
- 3875 Dorothy St
- 3865 Dorothy St
- 3883 Dorothy St
- 3846 Dorothy St
- 3857 Oliver St
- 3863 Oliver St
- 3871 Oliver St
- 3840 Dorothy St
- 3853 Oliver St
- 3858 Dorothy St
- 3830 Dorothy St
Your Personal Tour Guide
Ask me questions while you tour the home.