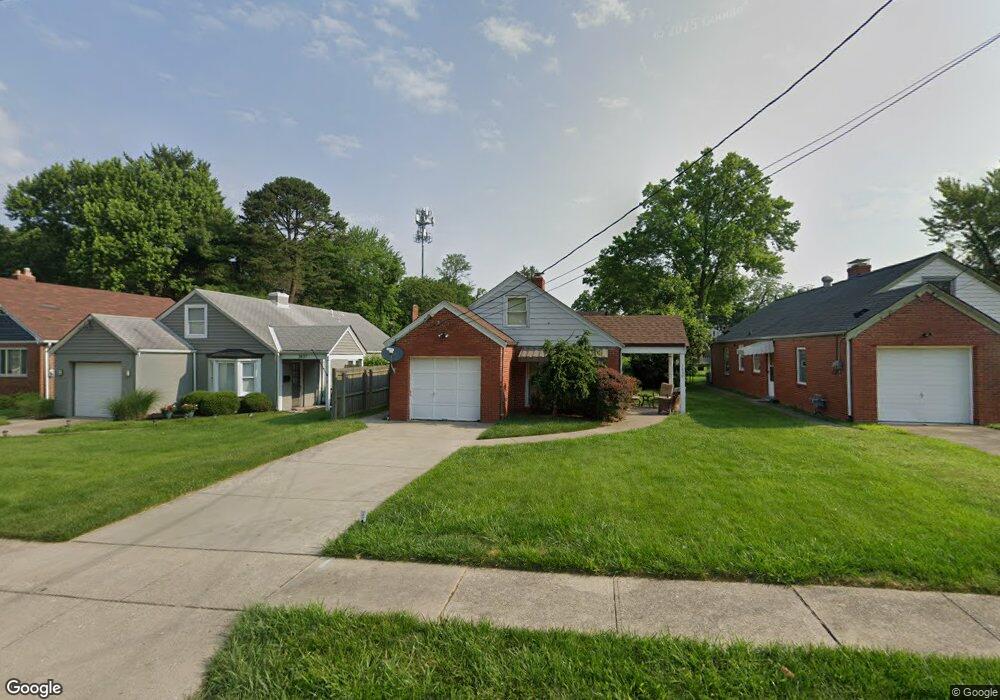
3839 Queen Crest Ave Cincinnati, OH 45236
Estimated Value: $198,202 - $251,000
3
Beds
1
Bath
1,020
Sq Ft
$221/Sq Ft
Est. Value
About This Home
This home is located at 3839 Queen Crest Ave, Cincinnati, OH 45236 and is currently estimated at $225,551, approximately $221 per square foot. 3839 Queen Crest Ave is a home located in Hamilton County with nearby schools including Silverton Paideia Elementary School, Shroder High School, and Clark Montessori High School.
Ownership History
Date
Name
Owned For
Owner Type
Purchase Details
Closed on
Sep 30, 2005
Sold by
Elsbrock James P and Elsbrock Susan M
Bought by
Hill Obelia C
Current Estimated Value
Purchase Details
Closed on
Apr 26, 2005
Sold by
Federal National Mortgage Association
Bought by
Elsbrock James P and Elsbrock Susan M
Home Financials for this Owner
Home Financials are based on the most recent Mortgage that was taken out on this home.
Original Mortgage
$64,000
Interest Rate
6.13%
Mortgage Type
Fannie Mae Freddie Mac
Purchase Details
Closed on
Dec 7, 2004
Sold by
Frazier Kimberly D
Bought by
Federal National Mortgage Association
Purchase Details
Closed on
Jul 24, 2001
Sold by
Frazier Brian R
Bought by
Frazier Kimberly D
Home Financials for this Owner
Home Financials are based on the most recent Mortgage that was taken out on this home.
Original Mortgage
$89,000
Interest Rate
6.97%
Purchase Details
Closed on
Nov 14, 1997
Sold by
Thacker Bruce Leonard and Thacker Omar Sharis
Bought by
Frazier Brian R
Create a Home Valuation Report for This Property
The Home Valuation Report is an in-depth analysis detailing your home's value as well as a comparison with similar homes in the area
Home Values in the Area
Average Home Value in this Area
Purchase History
| Date | Buyer | Sale Price | Title Company |
|---|---|---|---|
| Hill Obelia C | $109,000 | None Available | |
| Elsbrock James P | -- | Advanced Land Title Agency | |
| Federal National Mortgage Association | $70,000 | None Available | |
| Frazier Kimberly D | -- | First Service Title Agency I | |
| Frazier Brian R | $21,500 | -- | |
| Frazier Brian R | $21,500 | -- |
Source: Public Records
Mortgage History
| Date | Status | Borrower | Loan Amount |
|---|---|---|---|
| Previous Owner | Elsbrock James P | $64,000 | |
| Previous Owner | Frazier Kimberly D | $89,000 |
Source: Public Records
Tax History Compared to Growth
Tax History
| Year | Tax Paid | Tax Assessment Tax Assessment Total Assessment is a certain percentage of the fair market value that is determined by local assessors to be the total taxable value of land and additions on the property. | Land | Improvement |
|---|---|---|---|---|
| 2024 | $1,849 | $42,525 | $8,876 | $33,649 |
| 2023 | $1,940 | $42,525 | $8,876 | $33,649 |
| 2022 | $1,771 | $34,524 | $7,476 | $27,048 |
| 2021 | $1,712 | $34,524 | $7,476 | $27,048 |
| 2020 | $1,755 | $34,524 | $7,476 | $27,048 |
| 2019 | $1,625 | $30,286 | $6,559 | $23,727 |
| 2018 | $1,628 | $30,286 | $6,559 | $23,727 |
| 2017 | $1,547 | $30,286 | $6,559 | $23,727 |
| 2016 | $1,730 | $32,481 | $7,151 | $25,330 |
| 2015 | $1,572 | $32,481 | $7,151 | $25,330 |
| 2014 | $1,583 | $32,481 | $7,151 | $25,330 |
| 2013 | $1,427 | $29,796 | $6,559 | $23,237 |
Source: Public Records
Map
Nearby Homes
- 6535 Highland Ave
- 6914 Montgomery Rd
- 6508 Coleridge Ave
- 6502 Coleridge Ave
- 6829 Alpine Ave
- 3824 Standish Ave
- 6460 Mchugh Place
- 6456 Mchugh Place
- 6745 Belkenton Ave
- 6773 Siebern Ave
- 6705 Elwynne Dr
- 3717 Standish Ave
- 6218 Coleridge Ave
- 6724 Elwynne Dr
- 6631 Ravenal Ct
- 6212 Coleridge Ave
- 6733 Stoll Ln
- 3842 S Broadlawn Cir
- 3913 E Gatewood Ln
- 6124 Hedge Ave
- 3841 Queen Crest Ave
- 3843 Queen Crest Ave
- 3823 Queen Crest Ave
- 3832 Oak Crest Ave
- 3819 Queen Crest Ave
- 3845 Queen Crest Ave
- 3840 Oak Crest Ave
- 3828 Oak Crest Ave
- 3832 Queen Crest Ave
- 3844 Oak Crest Ave
- 3847 Queen Crest Ave
- 3809 Queen Crest Ave
- 3828 Queen Crest Ave
- 3840 Queen Crest Ave
- 3824 Queen Crest Ave
- 3848 Oak Crest Ave
- 3846 Queen Crest Ave
- 3820 Queen Crest Ave
- 3851 Queen Crest Ave
- 3824 Oak Crest Ave