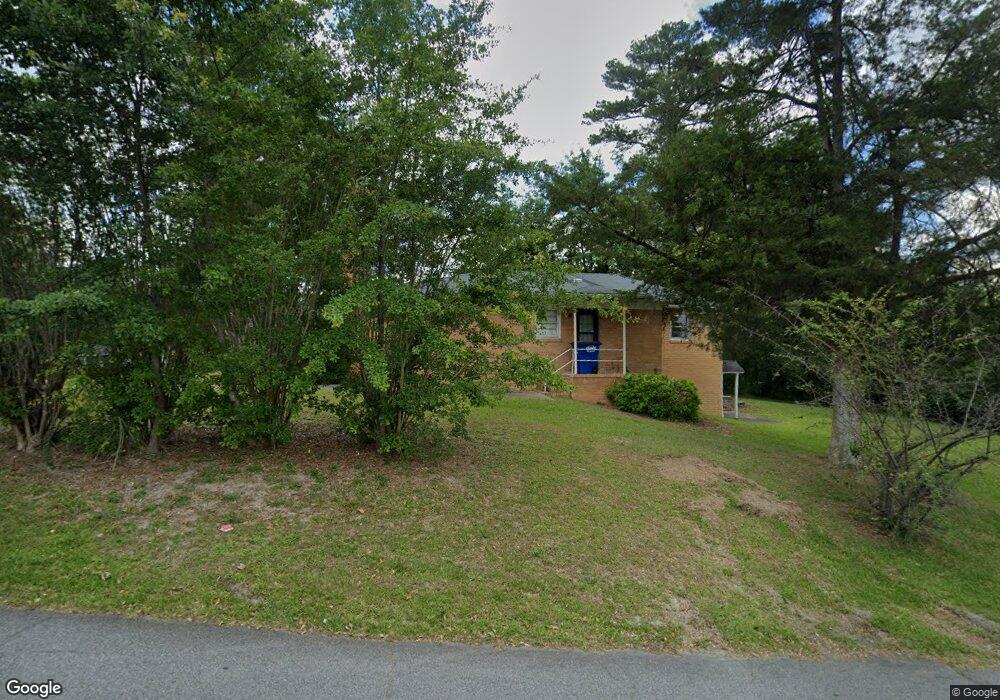
3839 Stacy Dr Macon, GA 31204
Estimated Value: $126,000 - $141,000
3
Beds
2
Baths
1,512
Sq Ft
$89/Sq Ft
Est. Value
About This Home
This home is located at 3839 Stacy Dr, Macon, GA 31204 and is currently estimated at $134,685, approximately $89 per square foot. 3839 Stacy Dr is a home located in Bibb County with nearby schools including Veterans Elementary School, Weaver Middle School, and Westside High School.
Ownership History
Date
Name
Owned For
Owner Type
Purchase Details
Closed on
Nov 30, 2012
Sold by
Chatfield Terry
Bought by
Le Reve Investments Llc
Current Estimated Value
Purchase Details
Closed on
Apr 7, 2011
Sold by
Asset Acquisition & Resolution Entity Ll
Bought by
Chatfield Terry
Purchase Details
Closed on
Mar 30, 2011
Sold by
Mtglq Investors Lp
Bought by
Asset Acquisition & Resolution Entity Ll
Purchase Details
Closed on
Oct 5, 2010
Sold by
Wells Fargo Bank Na
Bought by
Asset Acquisition & Resolution Entity Ll
Purchase Details
Closed on
Jul 12, 2010
Sold by
Wells Fargo Bank Na
Bought by
Mtglq Investors Lp
Purchase Details
Closed on
Jun 1, 2010
Sold by
Howard Maurice
Bought by
Wells Fargo Bank Na
Purchase Details
Closed on
Feb 10, 2004
Bought by
Howard Maurice
Purchase Details
Closed on
Aug 28, 2003
Create a Home Valuation Report for This Property
The Home Valuation Report is an in-depth analysis detailing your home's value as well as a comparison with similar homes in the area
Home Values in the Area
Average Home Value in this Area
Purchase History
| Date | Buyer | Sale Price | Title Company |
|---|---|---|---|
| Le Reve Investments Llc | -- | None Available | |
| Chatfield Terry | $22,500 | None Available | |
| Asset Acquisition & Resolution Entity Ll | -- | None Available | |
| Asset Acquisition & Resolution Entity Ll | -- | None Available | |
| Mtglq Investors Lp | $93,647 | None Available | |
| Wells Fargo Bank Na | $93,600 | -- | |
| Wells Fargo Bank Na | $93,647 | None Available | |
| Howard Maurice | $76,000 | -- | |
| -- | $42,000 | -- |
Source: Public Records
Tax History Compared to Growth
Tax History
| Year | Tax Paid | Tax Assessment Tax Assessment Total Assessment is a certain percentage of the fair market value that is determined by local assessors to be the total taxable value of land and additions on the property. | Land | Improvement |
|---|---|---|---|---|
| 2025 | $1,169 | $47,571 | $4,300 | $43,271 |
| 2024 | $1,133 | $44,593 | $3,125 | $41,468 |
| 2023 | $967 | $38,059 | $2,000 | $36,059 |
| 2022 | $1,040 | $30,046 | $4,144 | $25,902 |
| 2021 | $1,142 | $30,046 | $4,144 | $25,902 |
| 2020 | $1,167 | $30,046 | $4,144 | $25,902 |
| 2019 | $1,176 | $30,046 | $4,144 | $25,902 |
| 2018 | $1,981 | $30,046 | $4,144 | $25,902 |
| 2017 | $1,126 | $30,046 | $4,144 | $25,902 |
| 2016 | $1,040 | $30,046 | $4,144 | $25,902 |
| 2015 | $1,471 | $30,046 | $4,144 | $25,902 |
| 2014 | $1,692 | $30,046 | $4,144 | $25,902 |
Source: Public Records
Map
Nearby Homes
- 3771 Walker Ave
- 3850 Gadson Dr
- 4376 Log Cabin
- 4742 Bloomfield Rd
- 197 Camden Trace
- 165 Camden Trace
- 189 Camden Trace
- 120 Camden Trace
- 124 Camden Trace
- 193 Camden Trace
- 177 Camden Trace
- 1870 Bethlea Ave
- 1574 Colonial Dr
- 3896 Log Cabin Dr
- 1570 Colonial Dr
- 1573 Colonial Dr
- 3745 Partridge Dr
- 1531 Colonial Dr
- 4158 Log Cabin Dr
- 1740 Dixon Dr