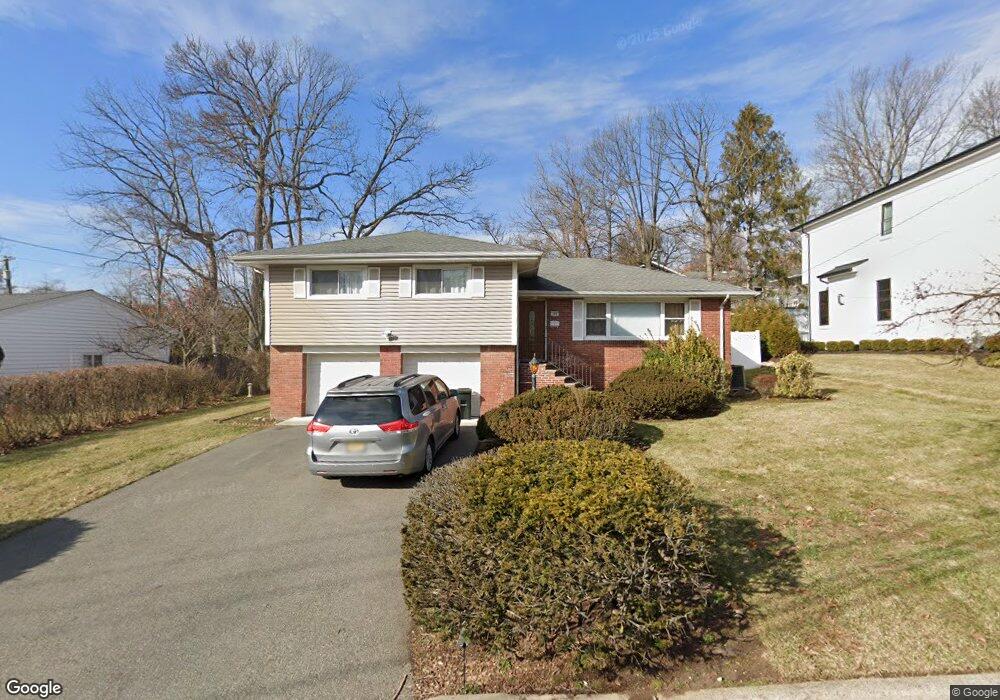
384 Castle Dr Englewood Cliffs, NJ 07632
Estimated Value: $1,289,000 - $1,321,733
3
Beds
3
Baths
1,896
Sq Ft
$688/Sq Ft
Est. Value
About This Home
This home is located at 384 Castle Dr, Englewood Cliffs, NJ 07632 and is currently estimated at $1,305,367, approximately $688 per square foot. 384 Castle Dr is a home located in Bergen County with nearby schools including North Cliff Elementary School, Upper School Elementary School, and Englewood on the Palisades Charter School.
Ownership History
Date
Name
Owned For
Owner Type
Purchase Details
Closed on
Mar 13, 2018
Sold by
Wenz Daniel and Wentz Jennifer S
Bought by
Nitzan Nurit and Ohayon Ilan
Current Estimated Value
Purchase Details
Closed on
Aug 17, 1997
Sold by
Tabares Iavier and Otiniano Oscar
Bought by
Wenz Daniel
Home Financials for this Owner
Home Financials are based on the most recent Mortgage that was taken out on this home.
Original Mortgage
$50,000
Interest Rate
6.67%
Create a Home Valuation Report for This Property
The Home Valuation Report is an in-depth analysis detailing your home's value as well as a comparison with similar homes in the area
Home Values in the Area
Average Home Value in this Area
Purchase History
| Date | Buyer | Sale Price | Title Company |
|---|---|---|---|
| Nitzan Nurit | $820,000 | -- | |
| Wenz Daniel | -- | -- |
Source: Public Records
Mortgage History
| Date | Status | Borrower | Loan Amount |
|---|---|---|---|
| Previous Owner | Wenz Daniel | $50,000 |
Source: Public Records
Tax History
| Year | Tax Paid | Tax Assessment Tax Assessment Total Assessment is a certain percentage of the fair market value that is determined by local assessors to be the total taxable value of land and additions on the property. | Land | Improvement |
|---|---|---|---|---|
| 2025 | $9,265 | $655,500 | $655,500 | -- |
| 2024 | $9,153 | $802,200 | $655,500 | $146,700 |
| 2023 | $9,009 | $802,200 | $655,500 | $146,700 |
| 2022 | $9,009 | $802,200 | $655,500 | $146,700 |
| 2021 | $6,924 | $802,200 | $655,500 | $146,700 |
| 2020 | $9,233 | $802,200 | $655,500 | $146,700 |
| 2019 | $8,672 | $802,200 | $655,500 | $146,700 |
| 2018 | $8,367 | $802,200 | $655,500 | $146,700 |
| 2017 | $8,006 | $802,200 | $655,500 | $146,700 |
| 2016 | $7,854 | $802,200 | $655,500 | $146,700 |
| 2015 | $7,460 | $802,200 | $655,500 | $146,700 |
| 2014 | $6,979 | $802,200 | $655,500 | $146,700 |
Source: Public Records
Map
Nearby Homes
- 365 Forest Dr
- 316 Bolz St
- 312 Bolz St
- 140 Demarest Ave
- 148 Demarest Ave
- 144 Demarest Ave
- 48 S Woodland St
- 394 E Palisade Ave
- 577 Floyd St
- 66 Elm St
- 285 Maple St
- 2 Maple St
- 645 Summit St
- 278 Fountain Rd
- 54 Van Nostrand Ave
- 662 Summit St
- 285 Arch Rd
- 244 Fairview Ave
- 48 Cambridge Place
- 231 N Woodland St
Your Personal Tour Guide
Ask me questions while you tour the home.