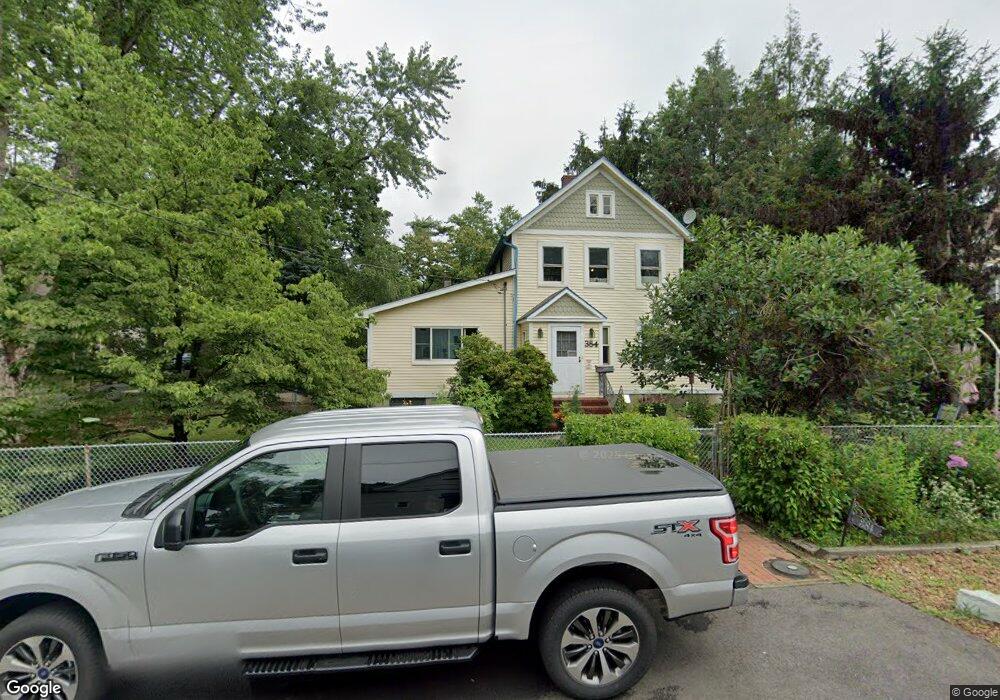
384 Chestnut St Stirling, NJ 07980
Estimated Value: $731,468 - $944,000
2
Beds
1
Bath
2,862
Sq Ft
$301/Sq Ft
Est. Value
About This Home
This home is located at 384 Chestnut St, Stirling, NJ 07980 and is currently estimated at $862,617, approximately $301 per square foot. 384 Chestnut St is a home located in Morris County with nearby schools including Gillette Elementary School, Millington Elementary School, and Central Middle School.
Ownership History
Date
Name
Owned For
Owner Type
Purchase Details
Closed on
Apr 25, 2017
Sold by
Potts Susan Collins and Potts Susan C
Bought by
Potts Susan Collins and Potts Susan C
Current Estimated Value
Purchase Details
Closed on
Aug 22, 2016
Sold by
Potts Susan Collins and Potts Susan C
Bought by
Potts Susan C and Nowak Joseph
Home Financials for this Owner
Home Financials are based on the most recent Mortgage that was taken out on this home.
Original Mortgage
$386,650
Outstanding Balance
$305,709
Interest Rate
3.37%
Mortgage Type
FHA
Estimated Equity
$556,908
Purchase Details
Closed on
Aug 14, 1997
Sold by
Birkenmeier Marilyn
Bought by
Potts Susan Collins
Home Financials for this Owner
Home Financials are based on the most recent Mortgage that was taken out on this home.
Original Mortgage
$195,000
Interest Rate
6.85%
Create a Home Valuation Report for This Property
The Home Valuation Report is an in-depth analysis detailing your home's value as well as a comparison with similar homes in the area
Home Values in the Area
Average Home Value in this Area
Purchase History
| Date | Buyer | Sale Price | Title Company |
|---|---|---|---|
| Potts Susan Collins | -- | Agent For Westcor Land Title | |
| Potts Susan C | -- | None Available | |
| Potts Susan Collins | -- | -- |
Source: Public Records
Mortgage History
| Date | Status | Borrower | Loan Amount |
|---|---|---|---|
| Open | Potts Susan C | $386,650 | |
| Previous Owner | Potts Susan Collins | $195,000 |
Source: Public Records
Tax History
| Year | Tax Paid | Tax Assessment Tax Assessment Total Assessment is a certain percentage of the fair market value that is determined by local assessors to be the total taxable value of land and additions on the property. | Land | Improvement |
|---|---|---|---|---|
| 2025 | $10,990 | $549,700 | $231,600 | $318,100 |
| 2024 | $10,711 | $490,200 | $226,600 | $263,600 |
| 2023 | $10,711 | $477,100 | $221,600 | $255,500 |
| 2022 | $11,411 | $457,700 | $211,600 | $246,100 |
| 2021 | $11,411 | $480,800 | $194,100 | $286,700 |
| 2020 | $11,650 | $480,800 | $194,100 | $286,700 |
| 2019 | $11,422 | $477,500 | $192,600 | $284,900 |
| 2018 | $11,191 | $471,000 | $189,600 | $281,400 |
| 2017 | $10,962 | $465,300 | $186,600 | $278,700 |
| 2016 | $10,705 | $455,900 | $181,600 | $274,300 |
| 2015 | $9,426 | $321,500 | $173,700 | $147,800 |
| 2014 | $9,221 | $321,500 | $173,700 | $147,800 |
Source: Public Records
Map
Nearby Homes
- 379 Elm St
- 355 Elm St
- 457 Elm St
- 246 246a Main Ave
- 231 Main Ave
- 350 Passaic Ave
- 8 Metzler St
- 128 Old Forge Rd
- 220 Stirling Rd
- 44 Madison St
- 1 Joss Way
- 28 Sunrise Dr
- 26 Sunrise Dr
- 19 Sunrise Dr Unit 3C
- 08-09 Castle Place
- 184 Hickory Tavern Rd
- 50 Mountain Ave
- 4 Marigold Ct
- 91 Hillcrest Rd
- 62 Smithfield Ct
Your Personal Tour Guide
Ask me questions while you tour the home.