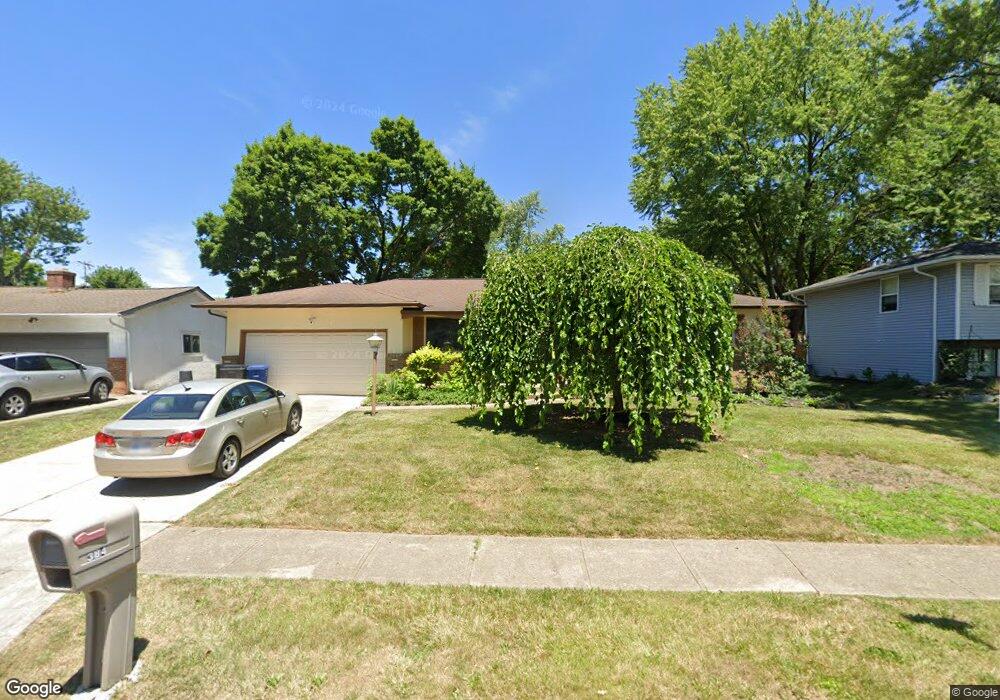
384 Dunbarton Rd Columbus, OH 43230
Gahanna-Havens Corners NeighborhoodEstimated Value: $260,000 - $314,000
3
Beds
2
Baths
1,441
Sq Ft
$200/Sq Ft
Est. Value
About This Home
This home is located at 384 Dunbarton Rd, Columbus, OH 43230 and is currently estimated at $288,128, approximately $199 per square foot. 384 Dunbarton Rd is a home located in Franklin County with nearby schools including Goshen Lane Elementary School, Gahanna West Middle School, and Lincoln High School.
Ownership History
Date
Name
Owned For
Owner Type
Purchase Details
Closed on
Nov 1, 2023
Sold by
Wc Cash Buyers Llc
Bought by
Payne Donald Anthony
Current Estimated Value
Home Financials for this Owner
Home Financials are based on the most recent Mortgage that was taken out on this home.
Original Mortgage
$264,000
Outstanding Balance
$258,089
Interest Rate
7.13%
Mortgage Type
New Conventional
Estimated Equity
$30,039
Purchase Details
Closed on
Oct 17, 2023
Sold by
Wc Cash Buyers Llc
Bought by
Payne Donald Anthony
Home Financials for this Owner
Home Financials are based on the most recent Mortgage that was taken out on this home.
Original Mortgage
$264,000
Outstanding Balance
$258,089
Interest Rate
7.13%
Mortgage Type
New Conventional
Estimated Equity
$30,039
Purchase Details
Closed on
Sep 20, 2022
Sold by
Fernandes Frazer
Bought by
Wc Cash Buyers Llc
Home Financials for this Owner
Home Financials are based on the most recent Mortgage that was taken out on this home.
Original Mortgage
$180,000
Interest Rate
5.55%
Mortgage Type
Construction
Purchase Details
Closed on
Aug 31, 2022
Sold by
Kelley Thelma L
Bought by
Fernandes Frazer
Home Financials for this Owner
Home Financials are based on the most recent Mortgage that was taken out on this home.
Original Mortgage
$180,000
Interest Rate
5.55%
Mortgage Type
Construction
Purchase Details
Closed on
Jun 2, 1987
Bought by
Burba Elizabeth A
Create a Home Valuation Report for This Property
The Home Valuation Report is an in-depth analysis detailing your home's value as well as a comparison with similar homes in the area
Home Values in the Area
Average Home Value in this Area
Purchase History
| Date | Buyer | Sale Price | Title Company |
|---|---|---|---|
| Payne Donald Anthony | -- | Atlas Title Solutions | |
| Payne Donald Anthony | -- | Atlas Title Solutions | |
| Wc Cash Buyers Llc | $200,000 | Gahanna Title | |
| Fernandes Frazer | $162,500 | Gahanna Title | |
| Burba Elizabeth A | -- | -- |
Source: Public Records
Mortgage History
| Date | Status | Borrower | Loan Amount |
|---|---|---|---|
| Open | Payne Donald Anthony | $264,000 | |
| Closed | Payne Donald Anthony | $264,000 | |
| Previous Owner | Wc Cash Buyers Llc | $180,000 |
Source: Public Records
Tax History
| Year | Tax Paid | Tax Assessment Tax Assessment Total Assessment is a certain percentage of the fair market value that is determined by local assessors to be the total taxable value of land and additions on the property. | Land | Improvement |
|---|---|---|---|---|
| 2025 | $7,534 | $87,430 | $33,040 | $54,390 |
| 2024 | $7,534 | $87,430 | $33,040 | $54,390 |
| 2023 | $5,190 | $87,430 | $33,040 | $54,390 |
| 2022 | $4,227 | $65,350 | $15,680 | $49,670 |
| 2021 | $4,088 | $65,350 | $15,680 | $49,670 |
| 2020 | $4,054 | $65,350 | $15,680 | $49,670 |
| 2019 | $3,259 | $54,150 | $13,090 | $41,060 |
| 2018 | $1,618 | $54,150 | $13,090 | $41,060 |
| 2017 | $2,991 | $54,150 | $13,090 | $41,060 |
| 2016 | $2,625 | $45,050 | $12,810 | $32,240 |
| 2015 | $1,314 | $45,050 | $12,810 | $32,240 |
| 2014 | $2,607 | $45,050 | $12,810 | $32,240 |
| 2013 | $1,295 | $45,045 | $12,810 | $32,235 |
Source: Public Records
Map
Nearby Homes
- 300 Dunbarton Rd
- 402 Citadel St
- 167 Lansdowne Ave
- 600 Agler Rd
- 3832 Emmons Ave
- 0 E Emmons Ave
- 2225 Mifflin Blvd
- 2876 Johnstown Rd
- 0 E Minnesota Ave Unit 224018641
- 0 E Aberdeen Ave Unit 226006710
- 3756 Genessee Ave
- 278 Empire Dr
- 258 Rocky Fork Dr S
- 221 Lincolnshire Rd
- 309 Baroness Way
- 643 Bonnington Way
- 329 Cliffview Dr
- 1822 Stelzer Rd
- 309 Broken Arrow Rd
- 169 Flint Ridge Dr
- 390 Dunbarton Rd
- 372 Dunbarton Rd
- 385 Hermitage Rd
- 398 Dunbarton Rd
- 393 Hermitage Rd
- 364 Dunbarton Rd
- 377 Hermitage Rd
- 391 Dunbarton Rd
- 373 Dunbarton Rd
- 399 Hermitage Rd
- 369 Hermitage Rd
- 356 Dunbarton Rd
- 406 Dunbarton Rd
- 363 Bowling Green Place
- 365 Dunbarton Rd
- 361 Hermitage Rd
- 334 Wittenberg St Unit L-72
- 364 Bowling Green Place
- 348 Dunbarton Rd
- 369 Bowling Green Place
Your Personal Tour Guide
Ask me questions while you tour the home.