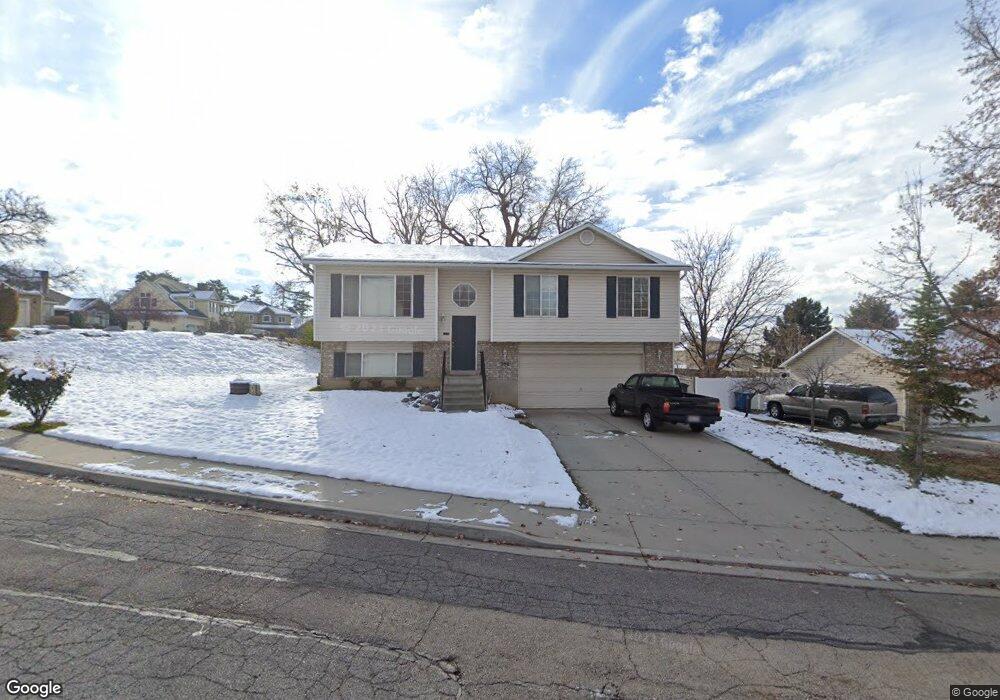
384 E 1500 N Pleasant Grove, UT 84062
Estimated Value: $530,000 - $552,000
4
Beds
3
Baths
1,672
Sq Ft
$324/Sq Ft
Est. Value
About This Home
This home is located at 384 E 1500 N, Pleasant Grove, UT 84062 and is currently estimated at $542,083, approximately $324 per square foot. 384 E 1500 N is a home located in Utah County with nearby schools including Grovecrest Elementary School, Pleasant Grove Junior High School, and Pleasant Grove High School.
Ownership History
Date
Name
Owned For
Owner Type
Purchase Details
Closed on
Mar 6, 2008
Sold by
Rivera Heriberto and Rivera Donna
Bought by
Fox Kim S
Current Estimated Value
Home Financials for this Owner
Home Financials are based on the most recent Mortgage that was taken out on this home.
Original Mortgage
$221,720
Outstanding Balance
$137,460
Interest Rate
5.65%
Mortgage Type
FHA
Estimated Equity
$404,623
Purchase Details
Closed on
May 17, 2006
Sold by
Rivera Eddie Heriberto and Rivera Donna
Bought by
Rivera Heriberto and Rivera Donna
Create a Home Valuation Report for This Property
The Home Valuation Report is an in-depth analysis detailing your home's value as well as a comparison with similar homes in the area
Home Values in the Area
Average Home Value in this Area
Purchase History
| Date | Buyer | Sale Price | Title Company |
|---|---|---|---|
| Fox Kim S | -- | Cache Title Company Salt L | |
| Rivera Heriberto | -- | Accommodation |
Source: Public Records
Mortgage History
| Date | Status | Borrower | Loan Amount |
|---|---|---|---|
| Open | Fox Kim S | $221,720 |
Source: Public Records
Tax History
| Year | Tax Paid | Tax Assessment Tax Assessment Total Assessment is a certain percentage of the fair market value that is determined by local assessors to be the total taxable value of land and additions on the property. | Land | Improvement |
|---|---|---|---|---|
| 2025 | $2,242 | $284,130 | -- | -- |
| 2024 | $2,242 | $261,635 | $0 | $0 |
| 2023 | $2,134 | $260,755 | $0 | $0 |
| 2022 | $2,183 | $265,430 | $0 | $0 |
| 2021 | $1,842 | $340,900 | $156,000 | $184,900 |
| 2020 | $1,711 | $310,500 | $139,300 | $171,200 |
| 2019 | $1,607 | $301,500 | $132,000 | $169,500 |
| 2018 | $1,533 | $272,000 | $124,600 | $147,400 |
| 2017 | $1,499 | $141,570 | $0 | $0 |
| 2016 | $1,386 | $126,445 | $0 | $0 |
| 2015 | $1,331 | $114,950 | $0 | $0 |
| 2014 | $1,217 | $104,115 | $0 | $0 |
Source: Public Records
Map
Nearby Homes
- 415 E 1560 N
- 429 E 1600 N
- 1633 N 150 E
- 540 E 990 N
- 344 E 900 N
- 825 N 350 E
- 1726 N Siena Cir Unit 10
- 795 N 535 E
- 1727 N Siena Cir Unit 4
- 1769 N Siena Cir Unit 2
- 411 E Daybreak Dr E
- 577 N 400 E
- 641 E 700 N
- 899 E 1190 N
- 2351 N 80 W Unit 12
- 1128 N 850 E
- 446 W 1420 N
- 240 Grove Creek Dr
- 1051 N 600 W
- 1041 N 600 W
Your Personal Tour Guide
Ask me questions while you tour the home.