Estimated Value: $374,324 - $418,000
3
Beds
2
Baths
1,531
Sq Ft
$260/Sq Ft
Est. Value
About This Home
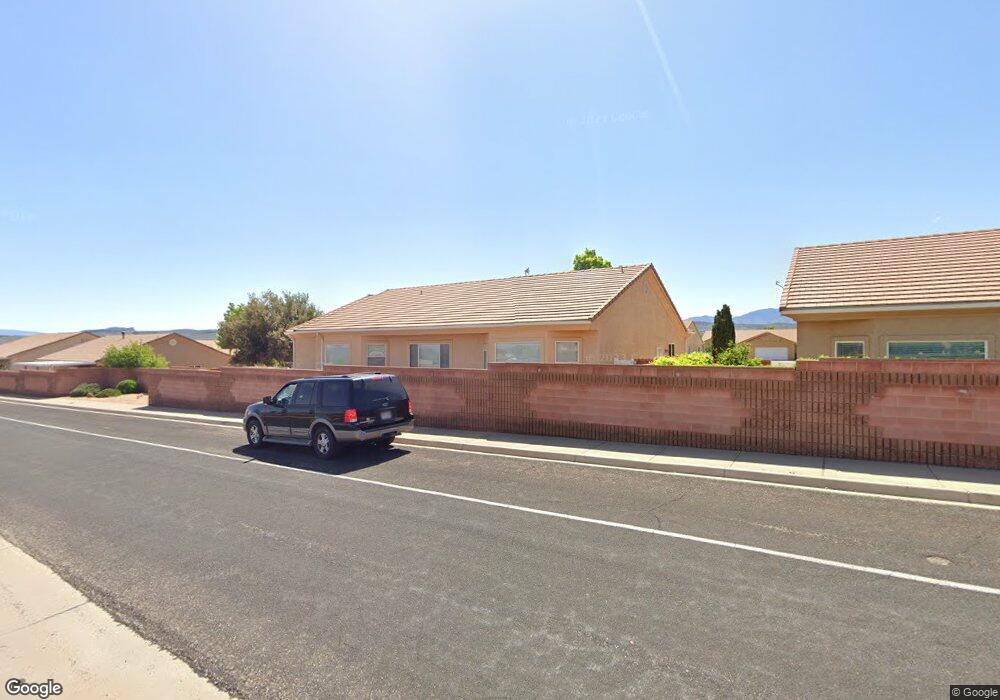
This home is located at 384 E 235 S, Ivins, UT 84738 and is currently estimated at $397,581, approximately $259 per square foot. 384 E 235 S is a home located in Washington County with nearby schools including Snow Canyon Middle School, Lava Ridge Intermediate School, and Snow Canyon High School.
Ownership History
Date
Name
Owned For
Owner Type
Purchase Details
Closed on
Jan 11, 2017
Sold by
Crow Robert F
Bought by
Crow Robert F
Current Estimated Value
Home Financials for this Owner
Home Financials are based on the most recent Mortgage that was taken out on this home.
Original Mortgage
$186,601
Outstanding Balance
$154,126
Interest Rate
4.2%
Estimated Equity
$243,455
Purchase Details
Closed on
Aug 26, 2014
Sold by
Hill Ruth Fay and Griffiths Susan Jeanne
Bought by
Crow Robert F and Crow Brenda
Home Financials for this Owner
Home Financials are based on the most recent Mortgage that was taken out on this home.
Original Mortgage
$189,795
Interest Rate
4.11%
Mortgage Type
New Conventional
Purchase Details
Closed on
Jan 25, 2006
Sold by
Hill Ruth Fay
Bought by
Hill Ruth Fay and Griffiths Susan Jeanne
Purchase Details
Closed on
Nov 21, 2005
Sold by
Barnes Roy J and Barnes Sharan D
Bought by
Hill Ruth Fay
Create a Home Valuation Report for This Property
The Home Valuation Report is an in-depth analysis detailing your home's value as well as a comparison with similar homes in the area
Home Values in the Area
Average Home Value in this Area
Purchase History
| Date | Buyer | Sale Price | Title Company |
|---|---|---|---|
| Crow Robert F | $219,500 | -- | |
| Crow Robert F | -- | Southern Utah Title | |
| Hill Ruth Fay | -- | First American Title Co | |
| Hill Ruth Fay | -- | First American Title Co |
Source: Public Records
Mortgage History
| Date | Status | Borrower | Loan Amount |
|---|---|---|---|
| Open | Crow Robert F | $186,601 | |
| Closed | Crow Robert F | -- | |
| Previous Owner | Crow Robert F | $189,795 |
Source: Public Records
Tax History Compared to Growth
Tax History
| Year | Tax Paid | Tax Assessment Tax Assessment Total Assessment is a certain percentage of the fair market value that is determined by local assessors to be the total taxable value of land and additions on the property. | Land | Improvement |
|---|---|---|---|---|
| 2025 | $1,399 | $211,420 | $46,750 | $164,670 |
| 2023 | $294 | $214,115 | $46,750 | $167,365 |
| 2022 | $1,904 | $214,555 | $46,750 | $167,805 |
| 2021 | $1,392 | $285,300 | $55,000 | $230,300 |
| 2020 | $1,254 | $243,200 | $45,000 | $198,200 |
| 2019 | $1,198 | $227,200 | $45,000 | $182,200 |
| 2018 | $1,312 | $128,040 | $0 | $0 |
| 2017 | $1,224 | $116,215 | $0 | $0 |
| 2016 | $1,259 | $110,385 | $0 | $0 |
| 2015 | $1,248 | $105,380 | $0 | $0 |
| 2014 | $1,224 | $103,840 | $0 | $0 |
Source: Public Records
Map
Nearby Homes