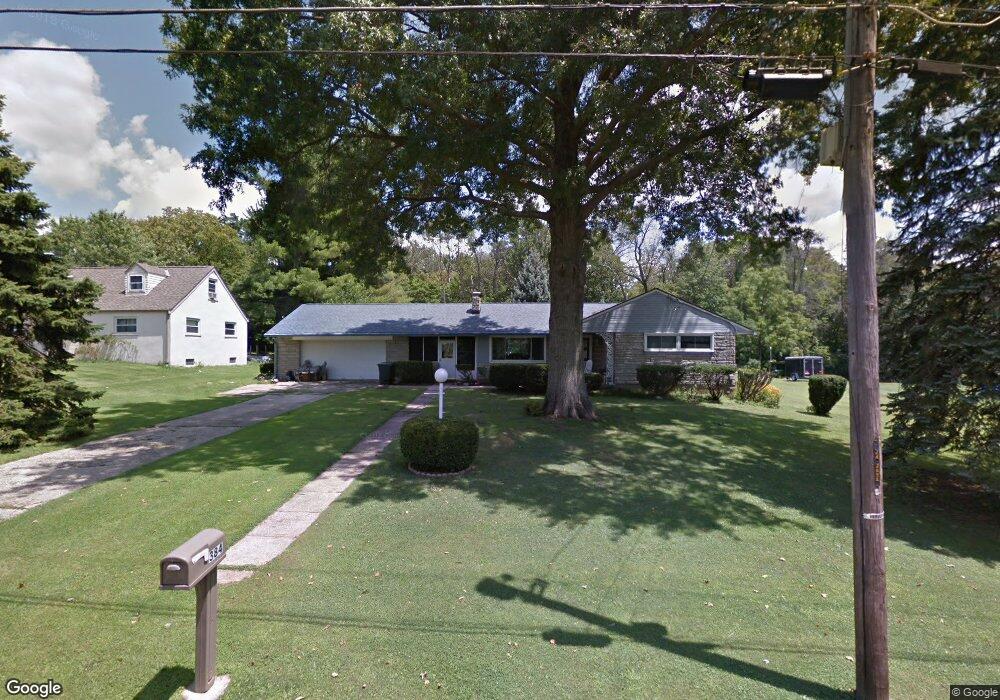
384 Klemme Dr Cincinnati, OH 45238
Delhi Hills NeighborhoodEstimated Value: $170,663 - $229,000
3
Beds
2
Baths
1,212
Sq Ft
$168/Sq Ft
Est. Value
About This Home
This home is located at 384 Klemme Dr, Cincinnati, OH 45238 and is currently estimated at $203,166, approximately $167 per square foot. 384 Klemme Dr is a home located in Hamilton County with nearby schools including C.O. Harrison Elementary School, Delhi Middle School, and Oak Hills High School.
Ownership History
Date
Name
Owned For
Owner Type
Purchase Details
Closed on
Dec 30, 2024
Sold by
Leen Michael D
Bought by
Emmitts Llc
Current Estimated Value
Purchase Details
Closed on
May 10, 2018
Sold by
Vickey E Rainey
Bought by
Leen Michael
Home Financials for this Owner
Home Financials are based on the most recent Mortgage that was taken out on this home.
Original Mortgage
$67,500
Interest Rate
4.55%
Purchase Details
Closed on
May 9, 2018
Sold by
Rainey Vicky E Tr
Bought by
Leen Michael D
Home Financials for this Owner
Home Financials are based on the most recent Mortgage that was taken out on this home.
Original Mortgage
$67,500
Interest Rate
4.55%
Purchase Details
Closed on
Jun 14, 2006
Sold by
Lawrence Raymond G and Lawrence Shirley R
Bought by
Lawrence Raymond G and Lawrence Shirley R
Purchase Details
Closed on
Sep 20, 1996
Sold by
Huff Jimmy Lee and Huff Gregory
Bought by
Lawrence Raymond G and Lawrence Shirley R
Create a Home Valuation Report for This Property
The Home Valuation Report is an in-depth analysis detailing your home's value as well as a comparison with similar homes in the area
Home Values in the Area
Average Home Value in this Area
Purchase History
We collect this data history from publicly available records. To have your information removed, we recommend requesting removal directly through your county’s website.
| Date | Buyer | Sale Price | Title Company |
|---|---|---|---|
| Emmitts Llc | $625,000 | Sundance Land Title Agency | |
| Emmitts Llc | $625,000 | Sundance Land Title Agency | |
| Leen Michael | $90,000 | -- | |
| Leen Michael D | $90,000 | -- | |
| Lawrence Raymond G | -- | None Available | |
| Lawrence Raymond G | $100,000 | -- |
Source: Public Records
Mortgage History
We collect this data history from publicly available records. To have your information removed, we recommend requesting removal directly through your county’s website.
| Date | Status | Borrower | Loan Amount |
|---|---|---|---|
| Previous Owner | Leen Michael D | $67,500 | |
| Previous Owner | Leen Michael D | -- | |
| Previous Owner | Leen Michael D | -- |
Source: Public Records
Tax History
| Year | Tax Paid | Tax Assessment Tax Assessment Total Assessment is a certain percentage of the fair market value that is determined by local assessors to be the total taxable value of land and additions on the property. | Land | Improvement |
|---|---|---|---|---|
| 2025 | $777 | $12,439 | $12,439 | -- |
| 2024 | $3,838 | $62,794 | $12,439 | $50,355 |
| 2023 | $3,780 | $62,794 | $12,439 | $50,355 |
| 2022 | $1,959 | $28,862 | $11,099 | $17,763 |
| 2021 | $1,956 | $28,862 | $11,099 | $17,763 |
| 2020 | $1,937 | $28,862 | $11,099 | $17,763 |
| 2019 | $2,342 | $31,276 | $9,569 | $21,707 |
| 2018 | $1,632 | $31,276 | $9,569 | $21,707 |
| 2017 | $1,467 | $31,276 | $9,569 | $21,707 |
| 2016 | $1,727 | $35,424 | $10,182 | $25,242 |
| 2015 | $1,737 | $35,424 | $10,182 | $25,242 |
| 2014 | $1,740 | $35,424 | $10,182 | $25,242 |
| 2013 | $1,752 | $37,289 | $10,717 | $26,572 |
Source: Public Records
Map
Nearby Homes
- 337 Greenwell Ave
- 316 Glenroy Ave
- 4805 Mayhew Ave
- 5110 Chantilly Dr
- 253 Greenwell Ave
- 250 Greenwell Ave
- 439 Pedretti Ave
- 263 Clareknoll Ct
- 5249 Blenheim Ct
- 5215 Scotland Dr
- 4729 Shadylawn Terrace
- 567 Greenwell Ave
- 493 Pedretti Ave
- 451 Kitty Ln
- 582 Greenwell Ave
- 224 Sebastian Ct
- 4778 Shadylawn Terrace
- 511 Claymore Terrace
- 5109 Whitmore Dr
- 4455 Cloverhill Terrace
- 388 Klemme Dr
- 376 Klemme Dr
- 4989 Delhi Ave
- 4995 Delhi Ave
- 4995 Delhi Rd
- 4977 Delhi Ave Unit 4A
- 4977 Delhi Ave Unit 4B
- 4977 Delhi Ave Unit 3
- 4977 Delhi Ave Unit 2
- 4977 Delhi Ave Unit 1
- 4983 Delhi Ave
- 4977 Delhi Pike
- 4965 Delhi Ave
- 4965 Delhi Pike
- 4959 Delhi Ave
- 4997 Delhi Ave
- 370 Klemme Dr
- 4959 Delhi Pike
- 374 Klemme Dr
- 4947 Delhi Ave
Your Personal Tour Guide
Ask me questions while you tour the home.