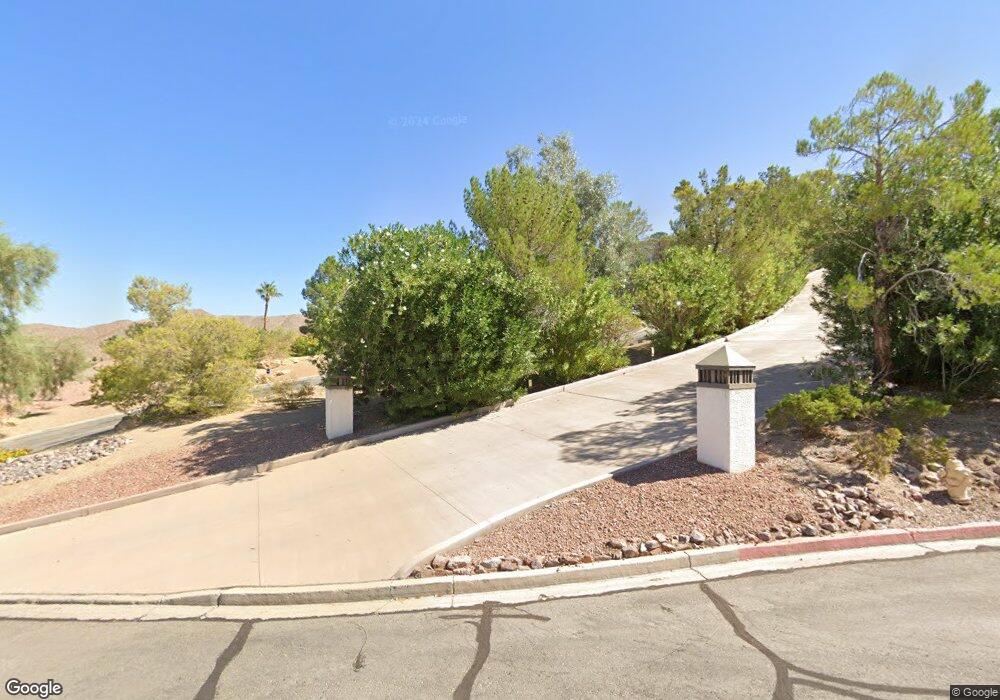
384 Laurel Dr Boulder City, NV 89005
Estimated Value: $1,104,333 - $1,406,000
3
Beds
4
Baths
2,189
Sq Ft
$542/Sq Ft
Est. Value
About This Home
This home is located at 384 Laurel Dr, Boulder City, NV 89005 and is currently estimated at $1,186,333, approximately $541 per square foot. 384 Laurel Dr is a home with nearby schools including Andrew Mitchell Elementary School, Martha P. King Elementary School, and Elton M. & Madelaine E. Garrett Junior High School.
Ownership History
Date
Name
Owned For
Owner Type
Purchase Details
Closed on
Apr 21, 2020
Sold by
Sabol Tracy H Kaiser
Bought by
Sabol Tracy H Kaiser and The Tracy Sabol Trust
Current Estimated Value
Purchase Details
Closed on
Oct 8, 2007
Sold by
Kaiser Herbert H
Bought by
Belding Suanne and Belding David R
Purchase Details
Closed on
Aug 9, 2007
Sold by
Lozowski Bradley and Lozowski Lori
Bought by
Kaiser Herbert H and Kaiser 1981 Trust
Purchase Details
Closed on
Mar 3, 2005
Sold by
Belding Suanne
Bought by
Lozowski Bradley and Lozowski Lori
Home Financials for this Owner
Home Financials are based on the most recent Mortgage that was taken out on this home.
Original Mortgage
$130,000
Interest Rate
5.7%
Mortgage Type
Unknown
Purchase Details
Closed on
Aug 1, 1995
Sold by
Hodge Ross
Bought by
Belding David R and Belding Suanne
Create a Home Valuation Report for This Property
The Home Valuation Report is an in-depth analysis detailing your home's value as well as a comparison with similar homes in the area
Home Values in the Area
Average Home Value in this Area
Purchase History
| Date | Buyer | Sale Price | Title Company |
|---|---|---|---|
| Sabol Tracy H Kaiser | -- | None Available | |
| Sabol Tracy H Kaiser | -- | None Available | |
| Belding Suanne | $842 | None Available | |
| Kaiser Herbert H | $450,000 | First Amer Title Co Of Nv | |
| Lozowski Bradley | $300,000 | First Amer Title Co Of Nv | |
| Belding David R | $70,000 | United Title |
Source: Public Records
Mortgage History
| Date | Status | Borrower | Loan Amount |
|---|---|---|---|
| Previous Owner | Lozowski Bradley | $130,000 | |
| Closed | Lozowski Bradley | $100,000 |
Source: Public Records
Tax History Compared to Growth
Tax History
| Year | Tax Paid | Tax Assessment Tax Assessment Total Assessment is a certain percentage of the fair market value that is determined by local assessors to be the total taxable value of land and additions on the property. | Land | Improvement |
|---|---|---|---|---|
| 2025 | $7,917 | $331,142 | $91,875 | $239,267 |
| 2024 | $7,687 | $331,142 | $91,875 | $239,267 |
| 2023 | $7,687 | $317,987 | $91,875 | $226,112 |
| 2022 | $7,463 | $296,494 | $91,875 | $204,619 |
| 2021 | $7,246 | $286,633 | $91,875 | $194,758 |
| 2020 | $7,033 | $269,486 | $77,175 | $192,311 |
| 2019 | $6,905 | $264,572 | $76,125 | $188,447 |
| 2018 | $6,721 | $258,220 | $76,125 | $182,095 |
| 2017 | $6,675 | $255,621 | $70,875 | $184,746 |
| 2016 | $6,360 | $242,437 | $68,250 | $174,187 |
| 2015 | $6,029 | $239,338 | $68,250 | $171,088 |
| 2014 | $5,821 | $52,500 | $52,500 | $0 |
Source: Public Records
Map
Nearby Homes
- 380 Claremont St
- 374 Claremont St
- 701 Park Place
- 650 Arizona St
- 1315 Alpine Dr
- 1318 Alpine Dr
- 698 Magic Cove Ct
- 1320 Alpine Dr
- 394 Arizona St
- 105 Lighthouse Dr Unit 723
- 144 Lake Mountain Dr
- 1409 Denver St
- 224 Morgyn Ln Unit 6
- Windsor Plan at Heritage Peak
- Somerset Plan at Heritage Peak
- 148 Tumbleweed Dr
- 620 Avenue H
- 624 Avenue H
- 655 Florence Dr
- 623 California Ave
- 378 Claremont St
- 382 Laurel Dr Unit 2
- 377 Laurel Dr
- 393 Avenue I Unit I
- 382 Claremont St
- 376 Claremont St
- 378 Laurel Dr
- 379 Claremont St
- 381 Claremont St
- 375 Laurel Dr
- 376 Laurel Dr
- 383 Claremont St
- 395 Avenue I
- 377 Claremont St
- 395 Avenue I
- 387 I Ave
- 387 Avenue I
- 383 Avenue I
- 379 Avenue I
- 370 Claremont St