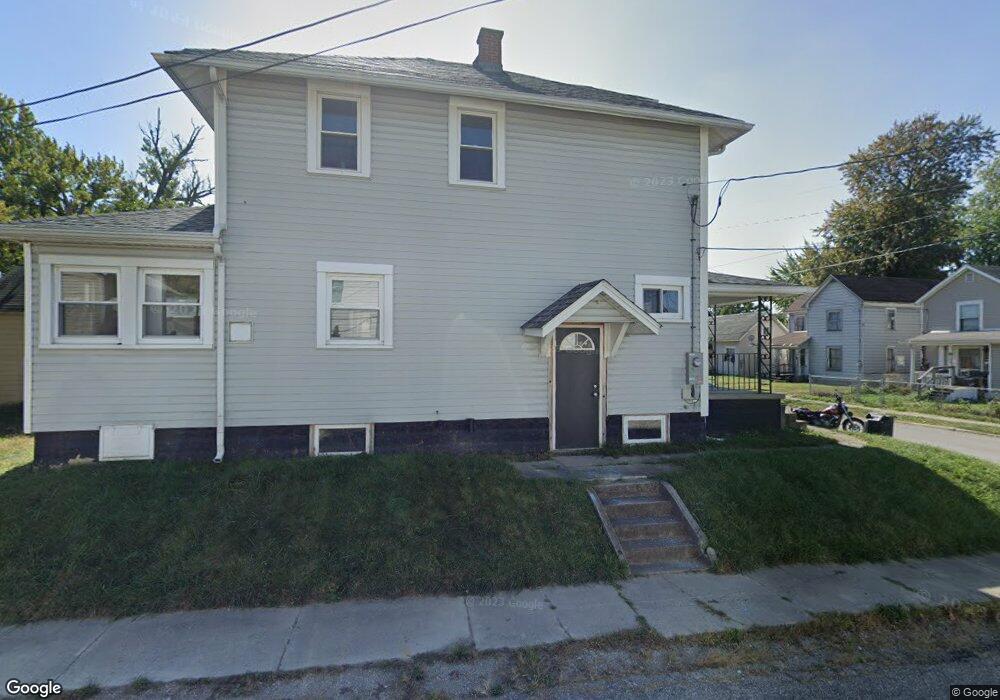
384 Mary St Marion, OH 43302
Estimated Value: $69,646 - $120,000
3
Beds
1
Bath
1,228
Sq Ft
$76/Sq Ft
Est. Value
About This Home
This home is located at 384 Mary St, Marion, OH 43302 and is currently estimated at $93,162, approximately $75 per square foot. 384 Mary St is a home located in Marion County with nearby schools including Rutherford B. Hayes Elementary School, Ulysses S. Grant Middle School, and Harding High School.
Ownership History
Date
Name
Owned For
Owner Type
Purchase Details
Closed on
Oct 13, 2020
Sold by
Gillespie Kimberly Jean and Thomas Johnny
Bought by
Johnson Kirby
Current Estimated Value
Purchase Details
Closed on
Mar 19, 2007
Sold by
Bank Of New York
Bought by
Gillespie Kimberly Jean
Purchase Details
Closed on
Aug 14, 2006
Sold by
Burroughs Timothy Jay and Etheridge Cheryl
Bought by
Bank Of New York and Cwabs Inc
Purchase Details
Closed on
Dec 13, 2004
Bought by
Gillespie Kimberly Jean
Purchase Details
Closed on
Feb 26, 2002
Bought by
Gillespie Kimberly Jean
Purchase Details
Closed on
Sep 18, 2001
Bought by
Gillespie Kimberly Jean
Purchase Details
Closed on
Aug 11, 1999
Bought by
Gillespie Kimberly Jean
Purchase Details
Closed on
Jun 19, 1998
Bought by
Gillespie Kimberly Jean
Create a Home Valuation Report for This Property
The Home Valuation Report is an in-depth analysis detailing your home's value as well as a comparison with similar homes in the area
Home Values in the Area
Average Home Value in this Area
Purchase History
| Date | Buyer | Sale Price | Title Company |
|---|---|---|---|
| Johnson Kirby | $9,500 | None Available | |
| Gillespie Kimberly Jean | $18,000 | Resource Title Agency | |
| Bank Of New York | -- | Sovereign Title Agency Llc | |
| Gillespie Kimberly Jean | $59,400 | -- | |
| Gillespie Kimberly Jean | $27,000 | -- | |
| Gillespie Kimberly Jean | $28,300 | -- | |
| Gillespie Kimberly Jean | -- | -- | |
| Gillespie Kimberly Jean | $23,000 | -- |
Source: Public Records
Tax History Compared to Growth
Tax History
| Year | Tax Paid | Tax Assessment Tax Assessment Total Assessment is a certain percentage of the fair market value that is determined by local assessors to be the total taxable value of land and additions on the property. | Land | Improvement |
|---|---|---|---|---|
| 2024 | $917 | $19,430 | $820 | $18,610 |
| 2023 | $917 | $19,430 | $820 | $18,610 |
| 2022 | $944 | $19,430 | $820 | $18,610 |
| 2021 | $1,008 | $15,020 | $710 | $14,310 |
| 2020 | $963 | $15,020 | $710 | $14,310 |
| 2019 | $1,179 | $15,020 | $710 | $14,310 |
| 2018 | $944 | $16,190 | $700 | $15,490 |
| 2017 | $961 | $16,190 | $700 | $15,490 |
| 2016 | $646 | $16,190 | $700 | $15,490 |
| 2015 | $647 | $15,860 | $670 | $15,190 |
| 2014 | $649 | $15,860 | $670 | $15,190 |
| 2012 | $763 | $18,550 | $710 | $17,840 |
Source: Public Records
Map
Nearby Homes
- 233 Tully St
- 347 Mary St
- 343 Commercial St
- 395 N Main St
- 551 Universal Ave Unit 555
- 552 N Prospect St
- 434 N State St
- 178 Leader St
- 636 Mary St
- 455 Park St
- 593 N State St
- 325 Holmes Place
- 468 Avondale Ave
- 458 Ballentine Ave
- 291 Patten St
- 485 Avondale Ave
- 736 N Main St
- 197 Harrison St
- 316 Patten St
- 520 Toledo Ave