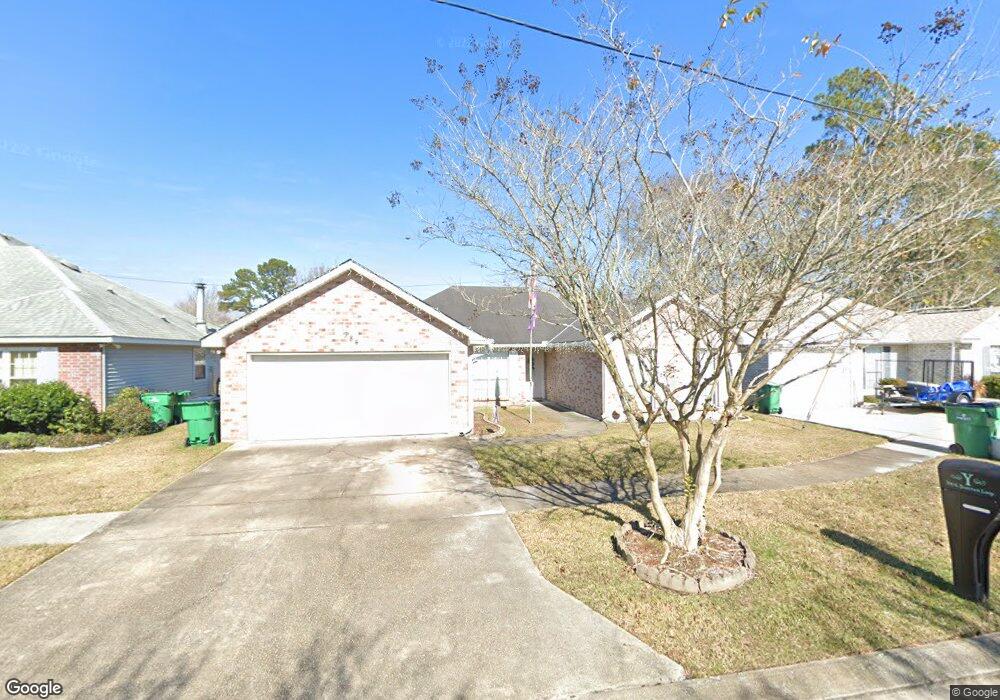
384 N Suncrest Loop None Slidell, LA 70458
Estimated Value: $210,066 - $231,000
3
Beds
3
Baths
1,623
Sq Ft
$135/Sq Ft
Est. Value
About This Home
This home is located at 384 N Suncrest Loop None, Slidell, LA 70458 and is currently estimated at $219,267, approximately $135 per square foot. 384 N Suncrest Loop None is a home located in St. Tammany Parish with nearby schools including Bonne Ecole Elementary School, Slidell Junior High School, and Slidell High School.
Ownership History
Date
Name
Owned For
Owner Type
Purchase Details
Closed on
Jun 7, 2016
Sold by
Foreman Francine
Bought by
Wolz Brandi Lynn
Current Estimated Value
Home Financials for this Owner
Home Financials are based on the most recent Mortgage that was taken out on this home.
Original Mortgage
$159,065
Outstanding Balance
$124,868
Interest Rate
3.57%
Mortgage Type
FHA
Estimated Equity
$94,399
Purchase Details
Closed on
Oct 27, 2010
Sold by
Bermes Craig D and Bermes Carolyn L
Bought by
Foreman Francine
Purchase Details
Closed on
May 29, 2009
Sold by
Davis Toni B and Davis Albert M
Bought by
Bermes Carolyn L and Bermes Craig D
Home Financials for this Owner
Home Financials are based on the most recent Mortgage that was taken out on this home.
Original Mortgage
$144,000
Interest Rate
4.76%
Mortgage Type
New Conventional
Create a Home Valuation Report for This Property
The Home Valuation Report is an in-depth analysis detailing your home's value as well as a comparison with similar homes in the area
Home Values in the Area
Average Home Value in this Area
Purchase History
| Date | Buyer | Sale Price | Title Company |
|---|---|---|---|
| Wolz Brandi Lynn | $162,000 | First American Title | |
| Foreman Francine | $150,000 | Delta Title Corporation | |
| Bermes Carolyn L | $160,000 | Titlamerica Inc |
Source: Public Records
Mortgage History
| Date | Status | Borrower | Loan Amount |
|---|---|---|---|
| Open | Wolz Brandi Lynn | $159,065 | |
| Previous Owner | Bermes Carolyn L | $144,000 |
Source: Public Records
Tax History
| Year | Tax Paid | Tax Assessment Tax Assessment Total Assessment is a certain percentage of the fair market value that is determined by local assessors to be the total taxable value of land and additions on the property. | Land | Improvement |
|---|---|---|---|---|
| 2025 | $1,494 | $16,501 | $2,000 | $14,501 |
| 2024 | $1,494 | $16,501 | $2,000 | $14,501 |
| 2023 | $1,617 | $14,123 | $2,000 | $12,123 |
| 2022 | $133,657 | $14,123 | $2,000 | $12,123 |
| 2021 | $1,336 | $14,123 | $2,000 | $12,123 |
| 2020 | $1,331 | $14,123 | $2,000 | $12,123 |
| 2019 | $2,507 | $14,368 | $2,500 | $11,868 |
| 2018 | $2,513 | $14,368 | $2,500 | $11,868 |
| 2017 | $2,530 | $14,368 | $2,500 | $11,868 |
| 2016 | $2,448 | $13,585 | $2,500 | $11,085 |
| 2015 | $1,321 | $13,800 | $2,500 | $11,300 |
| 2014 | $1,348 | $13,800 | $2,500 | $11,300 |
| 2013 | -- | $13,800 | $2,500 | $11,300 |
Source: Public Records
Map
Nearby Homes
- 384 N Suncrest Loop
- 382 N Suncrest Loop
- 386 N Suncrest Loop
- 388 N Suncrest Other
- 388 N Suncrest Loop
- 377 E Suncrest Loop
- 380 Suncrest
- 380 N Suncrest Loop
- 380 N Suncrest Other
- 375 E Suncrest Loop
- 375 E Suncrest Loop None
- 0 N Suncrest Other
- 0 N Suncrest Loop
- 390 N Suncrest Other
- 321 Robin Ln
- 378 E Suncrest Other
- 390 N Suncrest Loop
- 319 Robin Ln
- 376 E Suncrest Loop
- 387 N Suncrest Loop
Your Personal Tour Guide
Ask me questions while you tour the home.