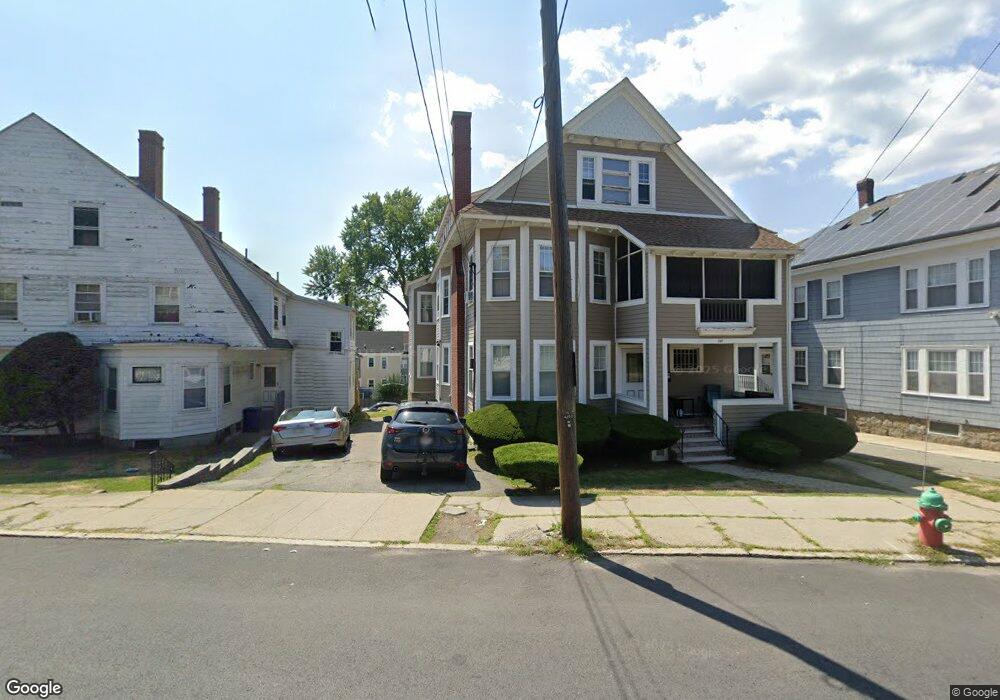
384 Prospect St Lawrence, MA 01841
Prospect Hill-Back Bay NeighborhoodEstimated Value: $908,000 - $996,000
About This Home
This home is located at 384 Prospect St, Lawrence, MA 01841 and is currently estimated at $956,000, approximately $204 per square foot. 384 Prospect St is a home located in Essex County with nearby schools including School For Exceptional Studies, Community Day Charter Public School - Gateway, and Esperanza Academy School of Hope.
Ownership History
We collect this data history from publicly available records. To have your information removed, we recommend requesting removal directly through your county’s website.
Purchase Details
Home Financials for this Owner
Home Financials are based on the most recent Mortgage that was taken out on this home.Home Values in the Area
Average Home Value in this Area
Purchase History
We collect this data history from publicly available records. To have your information removed, we recommend requesting removal directly through your county’s website.
| Date | Buyer | Sale Price | Title Company |
|---|---|---|---|
| $600,000 | -- | ||
| $600,000 | -- |
Mortgage History
We collect this data history from publicly available records. To have your information removed, we recommend requesting removal directly through your county’s website.
| Date | Status | Borrower | Loan Amount |
|---|---|---|---|
| Open | $404,000 | ||
| Closed | $404,000 | ||
| Previous Owner | $15,000 |
Tax History
We collect this data history from publicly available records. To have your information removed, we recommend requesting removal directly through your county’s website.
| Year | Tax Paid | Tax Assessment Tax Assessment Total Assessment is a certain percentage of the fair market value that is determined by local assessors to be the total taxable value of land and additions on the property. | Land | Improvement |
|---|---|---|---|---|
| 2025 | $7,491 | $851,200 | $116,200 | $735,000 |
| 2024 | $8,390 | $907,000 | $122,100 | $784,900 |
| 2023 | $7,813 | $769,000 | $117,900 | $651,100 |
| 2022 | $7,119 | $622,300 | $111,200 | $511,100 |
| 2021 | $6,617 | $539,300 | $111,200 | $428,100 |
| 2020 | $6,469 | $520,400 | $92,600 | $427,800 |
| 2019 | $6,620 | $483,900 | $68,800 | $415,100 |
| 2018 | $5,891 | $411,400 | $62,400 | $349,000 |
| 2017 | $5,788 | $377,300 | $68,600 | $308,700 |
| 2016 | $5,590 | $360,400 | $53,500 | $306,900 |
| 2015 | $5,230 | $345,900 | $53,500 | $292,400 |
Map
- 106 E Haverhill St
- 171 Ferry St
- 229 Jackson St
- 10 Swan St
- 15-17 Allyn Terrace
- 16 Quincy St
- 15 Bunkerhill St
- 36 Young Ave Unit B
- 244 E Haverhill St
- 172 High St
- 22 Lippold St
- 264 E Haverhill St Unit 2
- 264 E Haverhill St Unit 4
- 7 Erhardt Terrace
- 262 E Haverhill St Unit 21
- 1 Alderbrook Ln
- 2 Bailey St
- 35 Harmony Ln
- 168 Jackson St
- 7 Marie St
- 384 Prospect St Unit 2
- 7 Sheridan St Unit 2
- 5 Sheridan St Unit 2
- 5-7 Sheridan St
- 386 Prospect St
- 34 Highlawn Ave Unit 36
- 9 Sheridan St
- 4 Logan St Unit 2
- 2 Logan St Unit 1
- 2 Logan St
- 8 Logan St Unit 10
- 352 Prospect St
- 391 Prospect St
- 11 Sheridan St
- 68 Sheridan St
- 6-8 Sheridan St
- 351 Prospect St Unit 1
- 351 Prospect St
- 32 Highlawn Ave
- 348 Prospect St Unit 350
Ask me questions while you tour the home.