Estimated Value: $204,461 - $267,000
--
Bed
1
Bath
1,516
Sq Ft
$154/Sq Ft
Est. Value
About This Home
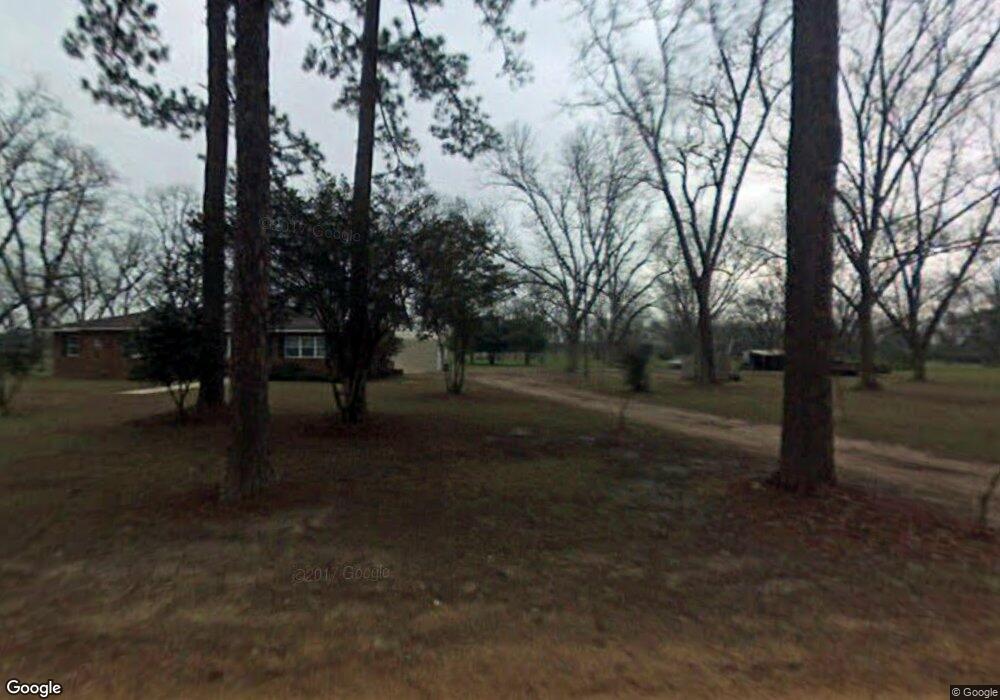
This home is located at 384 Richter Rd, Cairo, GA 39827 and is currently estimated at $233,154, approximately $153 per square foot. 384 Richter Rd is a home located in Grady County with nearby schools including Cairo High School.
Ownership History
Date
Name
Owned For
Owner Type
Purchase Details
Closed on
Jun 22, 2020
Sold by
Bowes Matthew
Bought by
Barrett Larry Andrew and Barrett Nicole
Current Estimated Value
Home Financials for this Owner
Home Financials are based on the most recent Mortgage that was taken out on this home.
Original Mortgage
$138,000
Outstanding Balance
$121,039
Interest Rate
3.2%
Mortgage Type
New Conventional
Estimated Equity
$112,115
Purchase Details
Closed on
Dec 3, 2019
Sold by
Norman John P
Bought by
Bowes Matthew A
Purchase Details
Closed on
May 22, 2009
Sold by
Capital City Bank
Bought by
Norman John P
Purchase Details
Closed on
Oct 31, 2007
Sold by
Reach Leanne
Bought by
Anderson Chris
Purchase Details
Closed on
Aug 25, 2006
Sold by
Whitfield Dwight B
Bought by
Anderson Chris
Purchase Details
Closed on
Dec 20, 1996
Sold by
Richter Winifred H
Bought by
Whitfield Dwight B
Purchase Details
Closed on
Oct 26, 1993
Bought by
Richter Winifred H
Create a Home Valuation Report for This Property
The Home Valuation Report is an in-depth analysis detailing your home's value as well as a comparison with similar homes in the area
Home Values in the Area
Average Home Value in this Area
Purchase History
| Date | Buyer | Sale Price | Title Company |
|---|---|---|---|
| Barrett Larry Andrew | $172,500 | -- | |
| Bowes Matthew A | $87,100 | -- | |
| Norman John P | $14,000 | -- | |
| Anderson Chris | -- | -- | |
| Anderson Chris | $105,100 | -- | |
| Whitfield Dwight B | $66,500 | -- | |
| Richter Winifred H | $30,000 | -- |
Source: Public Records
Mortgage History
| Date | Status | Borrower | Loan Amount |
|---|---|---|---|
| Open | Barrett Larry Andrew | $138,000 |
Source: Public Records
Tax History Compared to Growth
Tax History
| Year | Tax Paid | Tax Assessment Tax Assessment Total Assessment is a certain percentage of the fair market value that is determined by local assessors to be the total taxable value of land and additions on the property. | Land | Improvement |
|---|---|---|---|---|
| 2024 | $1,956 | $65,573 | $11,047 | $54,526 |
| 2023 | $1,265 | $43,100 | $5,397 | $37,703 |
| 2022 | $1,265 | $43,100 | $5,397 | $37,703 |
| 2021 | $1,250 | $42,459 | $5,397 | $37,062 |
| 2020 | $1,151 | $39,128 | $3,308 | $35,820 |
| 2019 | $1,151 | $39,128 | $3,308 | $35,820 |
| 2018 | $1,080 | $39,128 | $3,308 | $35,820 |
| 2017 | $1,028 | $39,128 | $3,308 | $35,820 |
| 2016 | $890 | $33,948 | $3,308 | $30,640 |
| 2015 | $879 | $33,948 | $3,308 | $30,640 |
| 2014 | -- | $33,948 | $3,308 | $30,640 |
| 2013 | -- | $31,753 | $4,095 | $27,658 |
Source: Public Records
Map
Nearby Homes
- 1016 Richter Rd
- 414 Woodland Rd
- 105 Woodridge Ln
- 158 Woodridge Ln
- 264 Woodridge Ln
- 00 State Route 188
- 0 State Route 188
- 1210 Elkins Rd
- 3136 State Route 188
- 000 15th Ave Nw -- Tract 2
- 000 15th Ave Nw -- Tract 1
- 1725 Tract 2 Hwy 84w
- 1725 Tract #1 Hwy 84w
- 1420 Parallel Dr NW
- 1490 Magnolia Dr
- 00 6th St NW
- 1200 15th Ave NW
- 00 NW 9th Ave
- 2975 U S 84
- 698 12th Ave NW