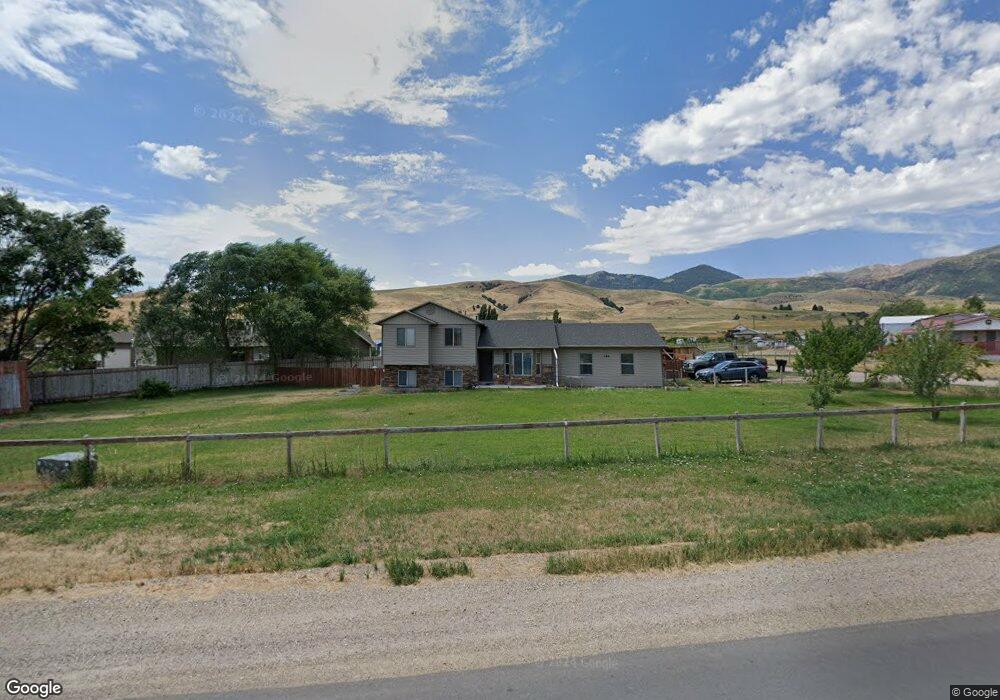
384 S Main Hwy Clifton, ID 83228
Estimated Value: $359,000 - $559,000
3
Beds
2
Baths
1,689
Sq Ft
$249/Sq Ft
Est. Value
About This Home
This home is located at 384 S Main Hwy, Clifton, ID 83228 and is currently estimated at $420,657, approximately $249 per square foot. 384 S Main Hwy is a home located in Franklin County with nearby schools including Harold B. Lee Elementary School, Harold B. Lee Middle School, and West Side Senior High School.
Ownership History
Date
Name
Owned For
Owner Type
Purchase Details
Closed on
Nov 15, 2023
Sold by
Choules Property Holdings Llc
Bought by
Choules Property Holdings Llc
Current Estimated Value
Purchase Details
Closed on
Aug 25, 2014
Sold by
Packer Jaron and Packer Vanesa
Bought by
Christensen Timothy D and Christensen Brenda Y
Home Financials for this Owner
Home Financials are based on the most recent Mortgage that was taken out on this home.
Original Mortgage
$163,000
Interest Rate
4.1%
Mortgage Type
Purchase Money Mortgage
Purchase Details
Closed on
Aug 12, 2011
Sold by
John L Hidley Llc
Bought by
Packer Jaron and Packer Vanesa
Home Financials for this Owner
Home Financials are based on the most recent Mortgage that was taken out on this home.
Original Mortgage
$158,355
Interest Rate
4.43%
Mortgage Type
New Conventional
Create a Home Valuation Report for This Property
The Home Valuation Report is an in-depth analysis detailing your home's value as well as a comparison with similar homes in the area
Home Values in the Area
Average Home Value in this Area
Purchase History
| Date | Buyer | Sale Price | Title Company |
|---|---|---|---|
| Choules Property Holdings Llc | -- | Northern Title Company | |
| Christensen Timothy D | -- | First American Title | |
| Packer Jaron | -- | First American Title Co |
Source: Public Records
Mortgage History
| Date | Status | Borrower | Loan Amount |
|---|---|---|---|
| Previous Owner | Christensen Timothy D | $163,000 | |
| Previous Owner | Packer Jaron | $158,355 |
Source: Public Records
Tax History Compared to Growth
Tax History
| Year | Tax Paid | Tax Assessment Tax Assessment Total Assessment is a certain percentage of the fair market value that is determined by local assessors to be the total taxable value of land and additions on the property. | Land | Improvement |
|---|---|---|---|---|
| 2025 | $1,121 | $282,385 | $60,000 | $222,385 |
| 2024 | $1,121 | $282,385 | $60,000 | $222,385 |
| 2023 | $1,011 | $273,482 | $60,000 | $213,482 |
| 2022 | $1,158 | $249,594 | $35,000 | $214,594 |
| 2021 | $1,173 | $228,290 | $35,000 | $193,290 |
| 2019 | $1,136 | $181,648 | $35,000 | $146,648 |
| 2018 | $1,063 | $155,975 | $27,500 | $128,475 |
| 2017 | $1,062 | $149,553 | $27,500 | $122,053 |
| 2016 | $1,082 | $144,616 | $27,500 | $117,116 |
| 2015 | $1,079 | $147,713 | $27,500 | $120,213 |
| 2014 | $5,580 | $147,713 | $27,500 | $120,213 |
| 2013 | $3,559 | $147,710 | $27,500 | $120,210 |
Source: Public Records
Map
Nearby Homes
- 30 W 100 S
- 3200 N 4400 W Unit 1
- 3200 N 4400 W Unit 2
- 4000 N 4400 W Unit 7
- 4000 N 4400 W Unit 4
- 3 Hull Lot of Littles Subdivisio Unit 3
- 5700 W Oxforrd Rd N Unit 1
- 2 Hull Lot of Littles Subdivisio Unit 2
- 1 Hull Lot of Littles Subdvision Unit 1
- N 4000 Rd W
- 4000 W 7200 N
- 1439 N Westside Hwy
- 1145 N Westside Hwy
- 1352 N 4000 W
- 1592 W 6700 N
- 1100 W 6700 Rd N
- 1542 N 1400 W
- 7500 N 1200 W
- 1542 N 1400 W
- 3515 W 100 S