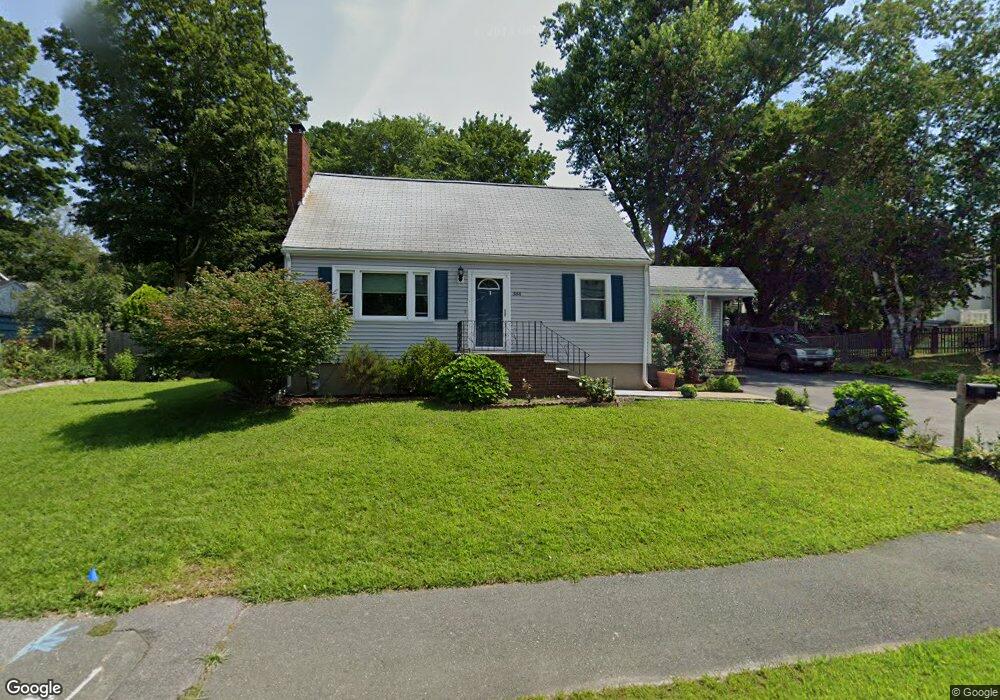
384 Salem St Woburn, MA 01801
Walnut Hill NeighborhoodEstimated Value: $711,000 - $885,000
3
Beds
2
Baths
1,950
Sq Ft
$413/Sq Ft
Est. Value
About This Home
This home is located at 384 Salem St, Woburn, MA 01801 and is currently estimated at $804,652, approximately $412 per square foot. 384 Salem St is a home located in Middlesex County with nearby schools including Stoneham High School, St. Patrick Elementary School, and St. Charles Elementary School.
Ownership History
Date
Name
Owned For
Owner Type
Purchase Details
Closed on
Feb 13, 1996
Sold by
Larz Rt and Neilson Larz
Bought by
Johnsons Rt and Elia John J
Current Estimated Value
Purchase Details
Closed on
Oct 11, 1994
Sold by
Mclean Paul E and Mclean Irene M
Bought by
Torres Hector M
Home Financials for this Owner
Home Financials are based on the most recent Mortgage that was taken out on this home.
Original Mortgage
$138,000
Interest Rate
8.55%
Mortgage Type
Purchase Money Mortgage
Create a Home Valuation Report for This Property
The Home Valuation Report is an in-depth analysis detailing your home's value as well as a comparison with similar homes in the area
Home Values in the Area
Average Home Value in this Area
Purchase History
| Date | Buyer | Sale Price | Title Company |
|---|---|---|---|
| Johnsons Rt | $78,000 | -- | |
| Torres Hector M | $148,000 | -- |
Source: Public Records
Mortgage History
| Date | Status | Borrower | Loan Amount |
|---|---|---|---|
| Open | Torres Hector M | $30,000 | |
| Open | Torres Hector M | $138,000 | |
| Previous Owner | Torres Hector M | $138,000 | |
| Previous Owner | Torres Hector M | $43,000 |
Source: Public Records
Tax History Compared to Growth
Tax History
| Year | Tax Paid | Tax Assessment Tax Assessment Total Assessment is a certain percentage of the fair market value that is determined by local assessors to be the total taxable value of land and additions on the property. | Land | Improvement |
|---|---|---|---|---|
| 2025 | $5,902 | $691,100 | $334,700 | $356,400 |
| 2024 | $5,302 | $657,800 | $318,700 | $339,100 |
| 2023 | $5,197 | $597,400 | $289,800 | $307,600 |
| 2022 | $5,123 | $548,500 | $252,000 | $296,500 |
| 2021 | $6,602 | $517,100 | $240,000 | $277,100 |
| 2020 | $4,578 | $491,200 | $240,000 | $251,200 |
| 2019 | $4,503 | $474,000 | $228,600 | $245,400 |
| 2018 | $6,134 | $440,300 | $209,700 | $230,600 |
| 2017 | $4,121 | $414,600 | $199,800 | $214,800 |
| 2016 | $3,934 | $391,400 | $186,700 | $204,700 |
| 2015 | $3,788 | $372,500 | $174,500 | $198,000 |
| 2014 | $3,396 | $325,300 | $174,500 | $150,800 |
Source: Public Records
Map
Nearby Homes
- 295 Salem St Unit 69
- 13 Elaine Rd
- 405 William St
- 97 Oak St
- 246 Walnut St
- 18 Carmen Terrace
- 18 Central St
- 75 Border Rd
- 13 Fremont St Unit 13
- 20 Oak St
- 200 Ledgewood Dr Unit 505
- 100 Ledgewood Dr Unit 417
- 100 Ledgewood Dr Unit 618
- 159 Main St Unit 41C
- 133 Pine Ridge Rd
- 6 Stratton Dr Unit 404
- 62 Abigail Way Unit 3004
- 68 Main St Unit 36C
- 64 Main St Unit 41B
- 40 Main St Unit 505