Estimated Value: $268,733 - $309,000
3
Beds
2
Baths
1,404
Sq Ft
$208/Sq Ft
Est. Value
About This Home
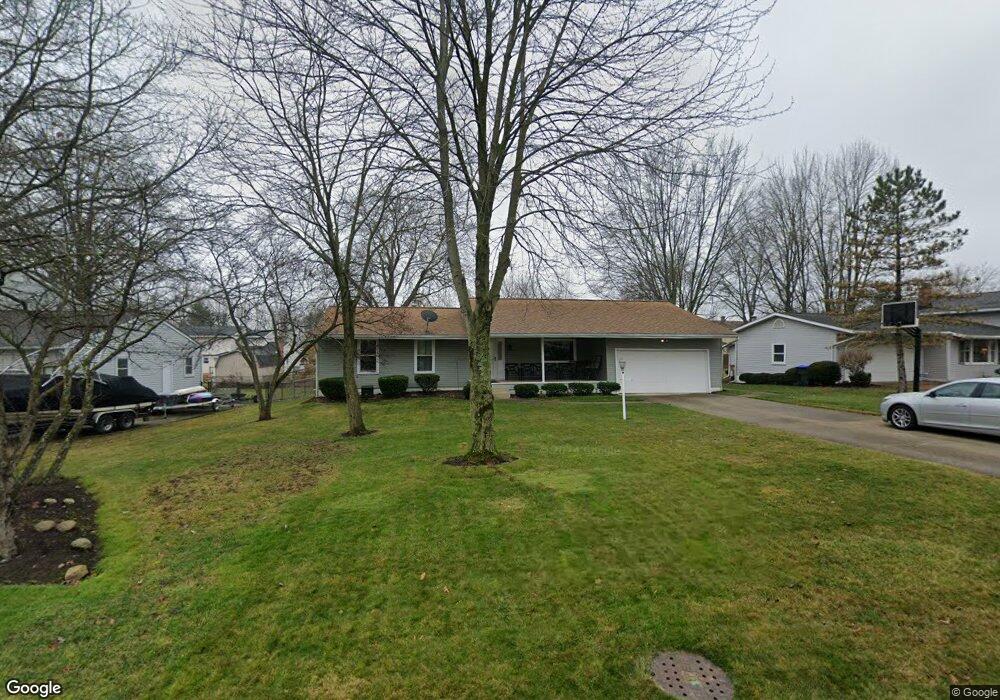
This home is located at 384 Scala Dr, Stow, OH 44224 and is currently estimated at $292,683, approximately $208 per square foot. 384 Scala Dr is a home located in Summit County with nearby schools including Woodridge Middle School, Woodridge High School, and Immaculate Heart Of Mary School.
Ownership History
Date
Name
Owned For
Owner Type
Purchase Details
Closed on
Mar 9, 2016
Sold by
Yarmesch Alan J and Yarmesch Wendy S
Bought by
Kamp David M and Kamp Christina M
Current Estimated Value
Home Financials for this Owner
Home Financials are based on the most recent Mortgage that was taken out on this home.
Original Mortgage
$110,000
Outstanding Balance
$47,719
Interest Rate
3.79%
Mortgage Type
New Conventional
Estimated Equity
$244,964
Purchase Details
Closed on
Sep 18, 1997
Sold by
Leyland John S
Bought by
Yarmesch Alan J and Yarmesch Wendy S
Home Financials for this Owner
Home Financials are based on the most recent Mortgage that was taken out on this home.
Original Mortgage
$123,200
Interest Rate
7.55%
Mortgage Type
New Conventional
Purchase Details
Closed on
Jul 31, 1995
Sold by
Westbury Nancy H
Bought by
Leyland John S and Bantum Julie A
Home Financials for this Owner
Home Financials are based on the most recent Mortgage that was taken out on this home.
Original Mortgage
$119,700
Interest Rate
7.59%
Mortgage Type
New Conventional
Create a Home Valuation Report for This Property
The Home Valuation Report is an in-depth analysis detailing your home's value as well as a comparison with similar homes in the area
Home Values in the Area
Average Home Value in this Area
Purchase History
| Date | Buyer | Sale Price | Title Company |
|---|---|---|---|
| Kamp David M | $168,000 | None Available | |
| Yarmesch Alan J | $136,000 | -- | |
| Leyland John S | $126,000 | -- |
Source: Public Records
Mortgage History
| Date | Status | Borrower | Loan Amount |
|---|---|---|---|
| Open | Kamp David M | $110,000 | |
| Closed | Yarmesch Alan J | $123,200 | |
| Previous Owner | Leyland John S | $119,700 |
Source: Public Records
Tax History Compared to Growth
Tax History
| Year | Tax Paid | Tax Assessment Tax Assessment Total Assessment is a certain percentage of the fair market value that is determined by local assessors to be the total taxable value of land and additions on the property. | Land | Improvement |
|---|---|---|---|---|
| 2025 | $4,145 | $69,707 | $12,422 | $57,285 |
| 2024 | $4,145 | $69,707 | $12,422 | $57,285 |
| 2023 | $4,145 | $69,707 | $12,422 | $57,285 |
| 2022 | $3,880 | $58,090 | $10,353 | $47,737 |
| 2021 | $3,914 | $58,090 | $10,353 | $47,737 |
| 2020 | $3,867 | $58,090 | $10,350 | $47,740 |
| 2019 | $3,435 | $47,610 | $9,600 | $38,010 |
| 2018 | $3,496 | $47,610 | $9,600 | $38,010 |
| 2017 | $3,243 | $47,610 | $9,600 | $38,010 |
| 2016 | $3,230 | $46,110 | $9,600 | $36,510 |
| 2015 | $3,243 | $46,110 | $9,600 | $36,510 |
| 2014 | $3,058 | $46,110 | $9,600 | $36,510 |
| 2013 | $3,192 | $48,260 | $9,600 | $38,660 |
Source: Public Records
Map
Nearby Homes
- V/L Diplomat Dr
- 4844 State Rd
- HOLLISTER Plan at Reserve at Boulder Estates
- ALDEN Plan at Reserve at Boulder Estates
- PARKETTE Plan at Reserve at Boulder Estates
- BELLEVILLE Plan at Reserve at Boulder Estates
- VANDERBURGH Plan at Reserve at Boulder Estates
- BUCHANAN Plan at Reserve at Boulder Estates
- BEACHWOOD Plan at Reserve at Boulder Estates
- 4850 State Rd
- 71 Salt Creek Run
- 52 Boulder Blvd
- 28 Boulder Blvd
- 5469 Sullivan Rd
- 4024 Glenrich Cir
- 5491 Sullivan Rd
- 3751 Wyoga Lake Rd
- 440 Crawford Cir
- 0 Lincoln Blvd
- V/L Housley Rd
- 374 Scala Dr
- 394 Scala Dr
- 381 Wyoga Lake Blvd
- 366 Scala Dr
- 373 Wyoga Lake Blvd
- 404 Scala Dr
- 389 Wyoga Lake Blvd
- 379 Scala Dr
- 365 Wyoga Lake Blvd
- 387 Scala Dr
- 371 Scala Dr
- 395 Scala Dr
- 414 Scala Dr
- 397 Wyoga Lake Blvd
- 363 Scala Dr
- 357 Wyoga Lake Blvd
- 411 Scala Dr
- 403 Scala Dr
- 355 Scala Dr
- 350 Scala Dr