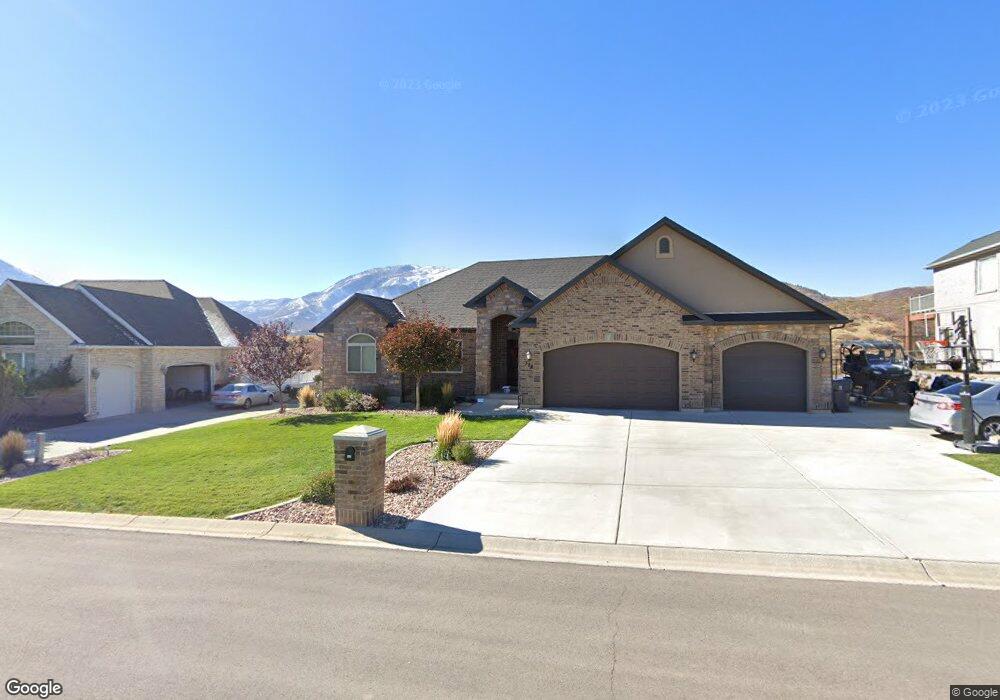
384 W Haleys Lookout Unit 2 Elk Ridge, UT 84651
Estimated Value: $698,000 - $758,984
2
Beds
3
Baths
1,947
Sq Ft
$370/Sq Ft
Est. Value
About This Home
This home is located at 384 W Haleys Lookout Unit 2, Elk Ridge, UT 84651 and is currently estimated at $719,996, approximately $369 per square foot. 384 W Haleys Lookout Unit 2 is a home located in Utah County with nearby schools including Foothills Elementary School, Valley View Middle School, and Salem Junior High School.
Ownership History
Date
Name
Owned For
Owner Type
Purchase Details
Closed on
Dec 14, 2012
Sold by
Linford Steven T and Linford Melanie C
Bought by
Linford Steven T and Linford Melanie C
Current Estimated Value
Home Financials for this Owner
Home Financials are based on the most recent Mortgage that was taken out on this home.
Original Mortgage
$164,500
Outstanding Balance
$30,264
Interest Rate
3.37%
Mortgage Type
New Conventional
Estimated Equity
$689,732
Purchase Details
Closed on
Aug 14, 2012
Sold by
Lindford Steven T and Lindford Melanie C
Bought by
Linford Steven T and Linford Melanie C
Purchase Details
Closed on
Aug 3, 2006
Sold by
Petersen Scott R and Petersen Marilyn
Bought by
Harris Julie E
Purchase Details
Closed on
Apr 4, 2005
Sold by
Petersen Scott R
Bought by
Petersen Scott R and Petersen Marilyn
Create a Home Valuation Report for This Property
The Home Valuation Report is an in-depth analysis detailing your home's value as well as a comparison with similar homes in the area
Home Values in the Area
Average Home Value in this Area
Purchase History
| Date | Buyer | Sale Price | Title Company |
|---|---|---|---|
| Linford Steven T | -- | Magellan Title | |
| Linford Steven T | -- | Magellam Title | |
| Harris Julie E | -- | First American Title Agency | |
| Petersen Scott R | -- | Wasatch Land & Title | |
| Petersen Scott R | -- | Wasatch Land & Title | |
| Martin Brent H | -- | Wasatch Land & Title |
Source: Public Records
Mortgage History
| Date | Status | Borrower | Loan Amount |
|---|---|---|---|
| Open | Linford Steven T | $164,500 |
Source: Public Records
Tax History Compared to Growth
Tax History
| Year | Tax Paid | Tax Assessment Tax Assessment Total Assessment is a certain percentage of the fair market value that is determined by local assessors to be the total taxable value of land and additions on the property. | Land | Improvement |
|---|---|---|---|---|
| 2025 | $3,356 | $664,400 | $262,900 | $401,500 |
| 2024 | $3,356 | $344,795 | $0 | $0 |
| 2023 | $3,383 | $348,535 | $0 | $0 |
| 2022 | $3,544 | $359,315 | $0 | $0 |
| 2021 | $3,010 | $472,000 | $174,300 | $297,700 |
| 2020 | $2,896 | $440,600 | $151,600 | $289,000 |
| 2019 | $2,810 | $435,700 | $146,700 | $289,000 |
| 2018 | $2,647 | $393,100 | $141,800 | $251,300 |
| 2017 | $2,338 | $185,350 | $0 | $0 |
| 2016 | $2,212 | $171,105 | $0 | $0 |
| 2015 | $2,181 | $165,385 | $0 | $0 |
| 2014 | $1,973 | $150,480 | $0 | $0 |
Source: Public Records
Map
Nearby Homes
- 135 W Cove Dr
- 53 High Sierra Dr S
- 107 W High Sierra Dr
- 65 W Coleys Cove
- 85 N Parkside Loop
- 94 W Hillside Dr
- 142 W Parkside Loop
- 288 S Hillside Dr
- 93 E Park Dr
- 51 E Magellan Ln
- 415 N Columbus Ln
- 75 S Astor Ln
- 300 E Magellan Ln
- 223 W Goosenest Dr
- 364 E Ocampo Ln
- 183 Ama Fille Ln N
- 359 E Magellan Ln N
- 764 N Burke Ln
- 650 E Bridger Ln
- 175 W Wolverine Creek
- 368 W Hayleys Lookout
- 368 W Haleys Lookout
- 402 W Haleys Lookout
- 403 W Haleys Lookout
- 341 W Hayleys Lookout St
- 341 W Hayleys Lookout St Unit 10
- 383 W Hayleys Lookout St Unit 2
- 349 W Haleys Lookout
- 382 W Haleys Lookout
- 407 W Haleys Lookout
- 342 W Haleys Lookout
- 396 W Haleys Lookout
- 323 W Haleys Lookout
- 323 W Haleys Lookout Unit 1
- 312 W Haleys Lookout
- 348 S Elk Ridge Dr
- 298 Grandview Cir
- 348 S Elk Ridge Dr
- 285 W High Sierra Dr
- 324 S Elk Ridge Dr