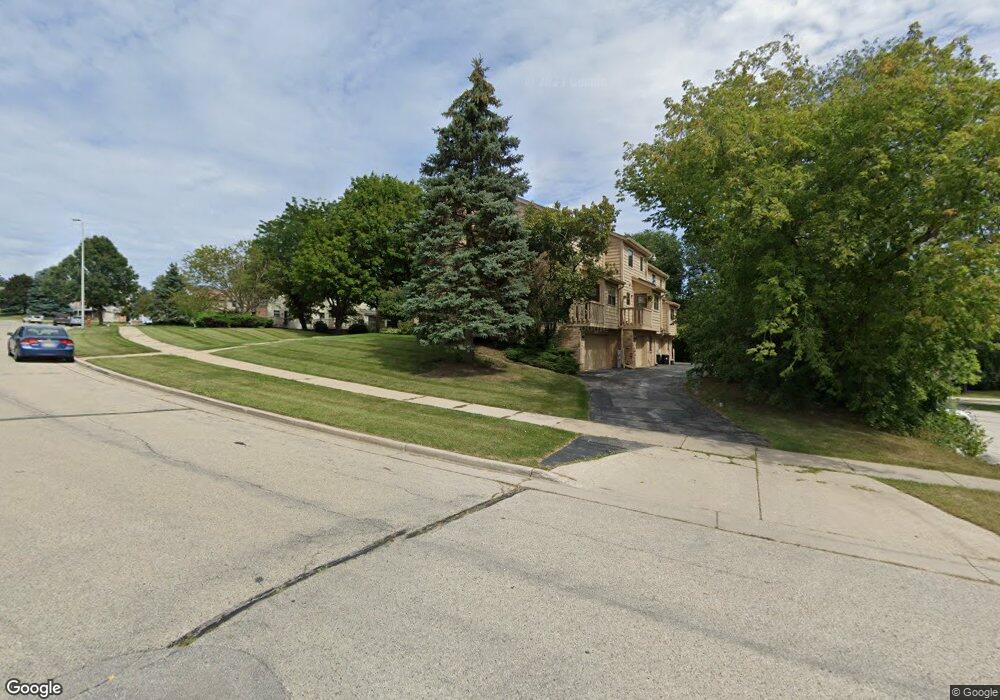
384 Willow Grove Dr Unit C Pewaukee, WI 53072
Estimated Value: $243,083 - $266,000
--
Bed
--
Bath
--
Sq Ft
0.76
Acres
About This Home
This home is located at 384 Willow Grove Dr Unit C, Pewaukee, WI 53072 and is currently estimated at $255,521. 384 Willow Grove Dr Unit C is a home located in Waukesha County with nearby schools including Pewaukee Lake Elementary School, Asa Clark Middle School, and Pewaukee High School.
Ownership History
Date
Name
Owned For
Owner Type
Purchase Details
Closed on
Oct 11, 2020
Sold by
Nemoure Narissa and Balistreri John M
Bought by
Chicorel Allison
Current Estimated Value
Home Financials for this Owner
Home Financials are based on the most recent Mortgage that was taken out on this home.
Original Mortgage
$162,900
Outstanding Balance
$144,891
Interest Rate
2.9%
Mortgage Type
New Conventional
Estimated Equity
$110,630
Purchase Details
Closed on
Feb 7, 2017
Sold by
Balistreri John M and Balistreri Therse
Bought by
Nemoure Narissa and Balistreri John M
Home Financials for this Owner
Home Financials are based on the most recent Mortgage that was taken out on this home.
Original Mortgage
$95,000
Interest Rate
4.2%
Mortgage Type
Purchase Money Mortgage
Purchase Details
Closed on
Dec 1, 2014
Sold by
Drake John C
Bought by
Balistreri John M and Balistreri Therse
Purchase Details
Closed on
Jun 4, 2010
Sold by
Drake Evelyn F
Bought by
Drake John C
Create a Home Valuation Report for This Property
The Home Valuation Report is an in-depth analysis detailing your home's value as well as a comparison with similar homes in the area
Home Values in the Area
Average Home Value in this Area
Purchase History
| Date | Buyer | Sale Price | Title Company |
|---|---|---|---|
| Chicorel Allison | $181,000 | Knight Barry Title | |
| Nemoure Narissa | -- | None Available | |
| Balistreri John M | $90,000 | None Available | |
| Drake John C | -- | None Available |
Source: Public Records
Mortgage History
| Date | Status | Borrower | Loan Amount |
|---|---|---|---|
| Open | Chicorel Allison | $162,900 | |
| Previous Owner | Nemoure Narissa | $95,000 |
Source: Public Records
Tax History Compared to Growth
Tax History
| Year | Tax Paid | Tax Assessment Tax Assessment Total Assessment is a certain percentage of the fair market value that is determined by local assessors to be the total taxable value of land and additions on the property. | Land | Improvement |
|---|---|---|---|---|
| 2024 | $2,435 | $195,200 | $20,000 | $175,200 |
| 2023 | $2,465 | $183,300 | $20,000 | $163,300 |
| 2022 | $2,434 | $179,500 | $18,000 | $161,500 |
| 2021 | $2,615 | $179,500 | $18,000 | $161,500 |
| 2020 | $2,516 | $161,600 | $18,000 | $143,600 |
| 2019 | $2,431 | $161,600 | $18,000 | $143,600 |
| 2018 | $1,970 | $132,800 | $18,000 | $114,800 |
| 2017 | $2,327 | $132,800 | $18,000 | $114,800 |
| 2016 | $2,212 | $131,100 | $10,000 | $121,100 |
| 2015 | $2,210 | $131,100 | $10,000 | $121,100 |
| 2014 | $2,412 | $131,100 | $10,000 | $121,100 |
| 2013 | $2,412 | $124,300 | $10,000 | $114,300 |
Source: Public Records
Map
Nearby Homes
- 1023 Waterstone Ct
- 1339 Hillwood Blvd Unit D
- 1136 Oxbow Ct
- 1019 Waterstone Ct
- 509 Westfield Way Unit F
- 1039 Waterstone Ct
- N35W23701 Auburn Ct Unit 1
- 353 Westfield Way
- 680 Brandt Ct
- W241N2573 E Parkway Meadow Cir Unit 3
- N28W25285 Parkway Ridge Cir Unit D Bldg 14 Unit 50
- N28W25285 Parkway Ridge Cir Unit C Bldg 14 Unit 49
- N28W25285 Madeline Blvd Unit A Bldg 14 Unit 52
- 636 Pewaukee Rd Unit H
- W241N2507 E Parkway Meadow Cir Unit 6
- W233N3088 Oakmont Ct E Unit B
- W243N2280 Deer Park Dr Unit A
- 602 Ole Dairy Rd
- W251N2413 Valleyview Cir
- W251N2371 Valleyview Cir
- 384 Willow Grove Dr Unit G
- 384 Willow Grove Dr Unit D
- 384 Willow Grove Dr Unit H
- 384 Willow Grove Dr Unit B
- 384 Willow Grove Dr Unit F
- 384 Willow Grove Dr Unit E
- 381 Willow Grove Dr Unit 383
- 383 Willow Grove Dr Unit 381
- 375 Willow Grove Dr Unit 377
- 362 Willow Grove Dr Unit B
- 362 Willow Grove Dr Unit D
- 362 Willow Grove Dr Unit H
- 362 Willow Grove Dr Unit C
- 362 Willow Grove Dr Unit F
- 362 Willow Grove Dr Unit G
- 362 Willow Grove Dr Unit A
- 362 Willow Grove Dr Unit E
- 387 Willow Grove Dr Unit 389
- 393 Willow Grove Dr
- 399 Willow Grove Dr