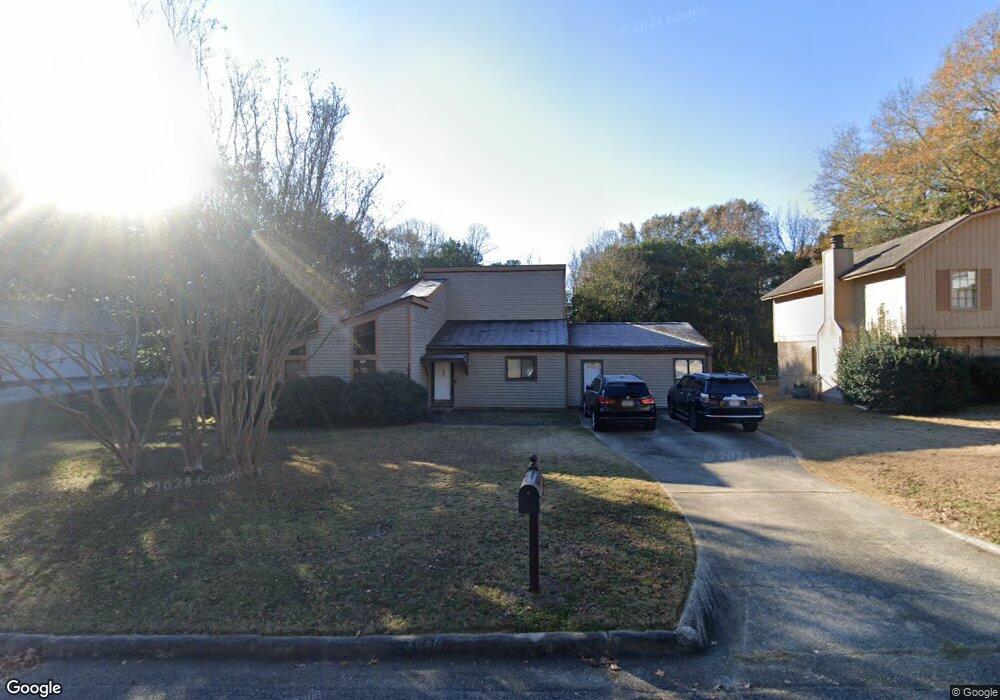
3840 Chris Dr Columbus, GA 31909
Northern Columbus NeighborhoodEstimated Value: $265,712 - $281,000
3
Beds
3
Baths
2,425
Sq Ft
$112/Sq Ft
Est. Value
About This Home
This home is located at 3840 Chris Dr, Columbus, GA 31909 and is currently estimated at $270,928, approximately $111 per square foot. 3840 Chris Dr is a home located in Muscogee County with nearby schools including Blanchard Elementary School, Veterans Memorial Middle School, and Hardaway High School.
Create a Home Valuation Report for This Property
The Home Valuation Report is an in-depth analysis detailing your home's value as well as a comparison with similar homes in the area
Home Values in the Area
Average Home Value in this Area
Tax History Compared to Growth
Tax History
| Year | Tax Paid | Tax Assessment Tax Assessment Total Assessment is a certain percentage of the fair market value that is determined by local assessors to be the total taxable value of land and additions on the property. | Land | Improvement |
|---|---|---|---|---|
| 2025 | $1,704 | $76,024 | $10,796 | $65,228 |
| 2024 | $1,703 | $76,024 | $10,796 | $65,228 |
| 2023 | $1,019 | $76,024 | $10,796 | $65,228 |
| 2022 | $1,775 | $55,464 | $10,796 | $44,668 |
| 2021 | $1,769 | $56,708 | $10,796 | $45,912 |
| 2020 | $1,769 | $56,708 | $10,796 | $45,912 |
| 2019 | $1,777 | $56,708 | $10,796 | $45,912 |
| 2018 | $1,777 | $56,708 | $10,796 | $45,912 |
| 2017 | $2,389 | $56,708 | $10,796 | $45,912 |
| 2016 | $1,870 | $45,337 | $5,800 | $39,537 |
| 2015 | $1,872 | $45,337 | $5,800 | $39,537 |
| 2014 | $1,875 | $45,337 | $5,800 | $39,537 |
| 2013 | -- | $45,337 | $5,800 | $39,537 |
Source: Public Records
Map
Nearby Homes
- 3824 Lyn Dr
- 6200 Karen Ct
- 3732 Arrel Dr
- 6104 Candlestick Loop
- 3919 Gray Fox Dr
- 6221 Charing Dr
- 4036 Wilbur Dr
- 22 Nettle Ct
- 5829 Moon Rd
- 6717 Moon Cir
- 4245 N Oaks Dr
- 3325 N North Quay Dr
- 6138 Seaton Dr
- 6813 Panstone Dr
- 6158 Arrington Dr
- 4320 Canady St
- 5836 Sherborne Dr
- 3204 Weems Rd
- 5817 Sherborne Dr
- 6910 Cinnamon Loop