Estimated Value: $593,000 - $793,083
5
Beds
3
Baths
2,303
Sq Ft
$295/Sq Ft
Est. Value
About This Home
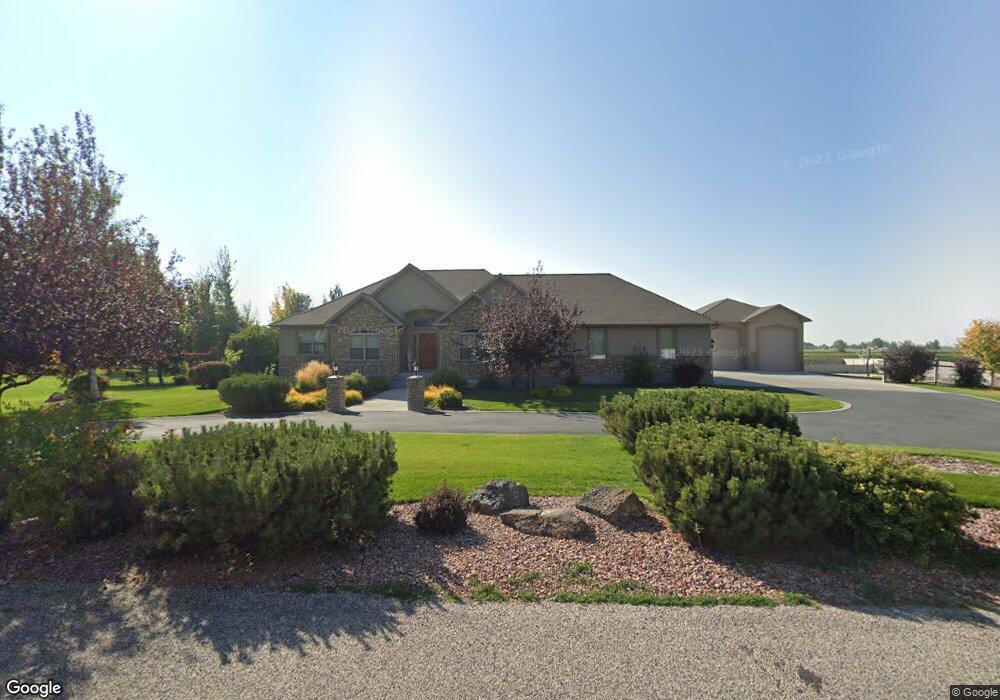
This home is located at 3840 E 392 N, Rigby, ID 83442 and is currently estimated at $679,021, approximately $294 per square foot. 3840 E 392 N is a home located in Jefferson County with nearby schools including Jefferson Elementary School, Rigby Middle School, and Rigby High School.
Ownership History
Date
Name
Owned For
Owner Type
Purchase Details
Closed on
Jun 27, 2024
Sold by
Tanner Investments Llc
Bought by
Crapo Susan
Current Estimated Value
Purchase Details
Closed on
Dec 30, 2022
Sold by
Ohannesian Michael Robert and Ohannesian Kathleen Ann
Bought by
Tanner Investments Llc
Purchase Details
Closed on
Aug 30, 2022
Sold by
J & L Holdings Llc
Bought by
Ohannesian Michael Robert and Ohannesian Kathleen Ann
Create a Home Valuation Report for This Property
The Home Valuation Report is an in-depth analysis detailing your home's value as well as a comparison with similar homes in the area
Home Values in the Area
Average Home Value in this Area
Purchase History
| Date | Buyer | Sale Price | Title Company |
|---|---|---|---|
| Crapo Susan | -- | Pioneer Title | |
| Tanner Investments Llc | -- | Amerititle | |
| Ohannesian Michael Robert | -- | Amerititle |
Source: Public Records
Tax History Compared to Growth
Tax History
| Year | Tax Paid | Tax Assessment Tax Assessment Total Assessment is a certain percentage of the fair market value that is determined by local assessors to be the total taxable value of land and additions on the property. | Land | Improvement |
|---|---|---|---|---|
| 2024 | $2,651 | $746,332 | $0 | $0 |
| 2023 | $2,651 | $860,045 | $0 | $0 |
| 2022 | $4,482 | $771,176 | $0 | $0 |
| 2021 | $3,757 | $530,912 | $0 | $0 |
| 2020 | $2,918 | $481,219 | $0 | $0 |
| 2019 | $3,320 | $430,582 | $0 | $0 |
| 2018 | $3,047 | $386,073 | $0 | $0 |
| 2017 | $2,858 | $358,403 | $0 | $0 |
| 2016 | $2,611 | $231,640 | $0 | $0 |
| 2015 | $2,517 | $214,830 | $0 | $0 |
| 2014 | $2,588 | $220,490 | $0 | $0 |
| 2013 | -- | $219,814 | $0 | $0 |
Source: Public Records
Map
Nearby Homes
- 3860 E 390 N
- 3814 E 400 N
- TBD N 3826 E
- 3864 E 380 N
- 416 Franklin St
- 664 N Lincoln St
- 568 Washington Loop
- 423 N 3836 E
- TBD E 400 N
- 409 Richardson St
- 561 Lincoln St
- 419 N 4th W
- 3834 E 446 N
- 653 N 3rd W
- 571 N 3rd W
- 687 N 3rd W
- 598 W 1st N
- 385 Summerwood Dr
- The Scotty Plan at Saddle Hill
- The William Plan at Saddle Hill