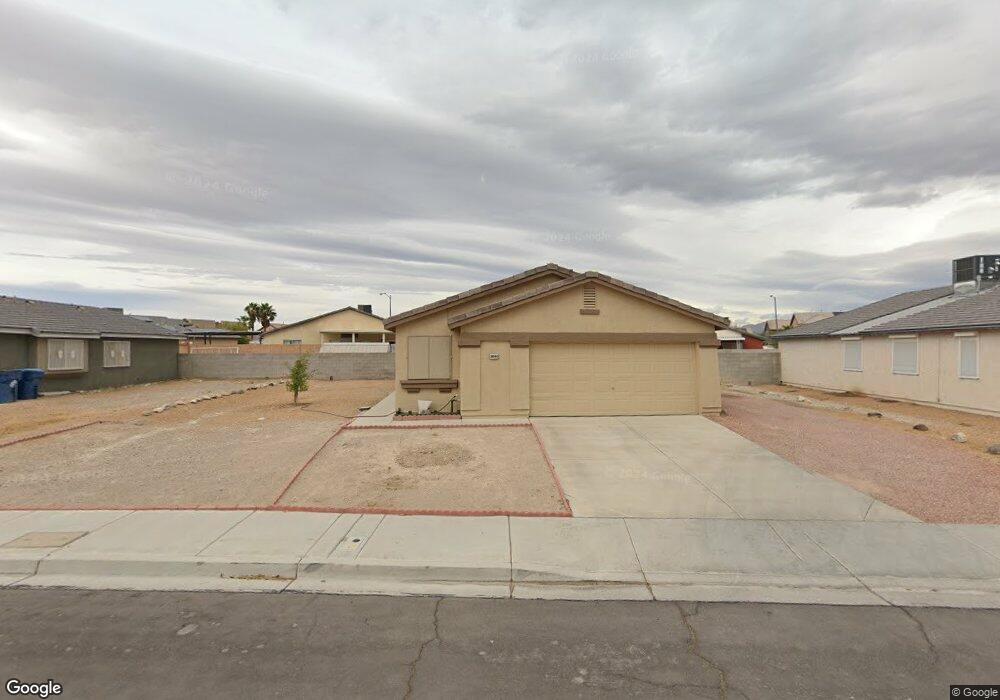
3840 Gold Mist Ave Las Vegas, NV 89115
Estimated Value: $275,000 - $365,000
3
Beds
2
Baths
1,410
Sq Ft
$238/Sq Ft
Est. Value
About This Home
This home is located at 3840 Gold Mist Ave, Las Vegas, NV 89115 and is currently estimated at $335,350, approximately $237 per square foot. 3840 Gold Mist Ave is a home located in Clark County with nearby schools including Clyde C. Cox Elementary School, Gwendolyn Woolley Elementary School, and Marvin M Sedway Middle School.
Ownership History
Date
Name
Owned For
Owner Type
Purchase Details
Closed on
Jan 14, 2003
Sold by
Morales Ma Carmen
Bought by
Alvarez Jose R
Current Estimated Value
Home Financials for this Owner
Home Financials are based on the most recent Mortgage that was taken out on this home.
Original Mortgage
$104,954
Outstanding Balance
$45,198
Interest Rate
6.15%
Estimated Equity
$290,152
Purchase Details
Closed on
Sep 12, 2001
Sold by
Gmac Mtg Corp
Bought by
Hud
Purchase Details
Closed on
Apr 6, 2001
Sold by
Moore Bobby K and Moore Marsha E
Bought by
Taheebo Enterprises Inc
Purchase Details
Closed on
Oct 25, 1999
Sold by
Hearthstone Homebuilders Inc
Bought by
Moore Bobby K and Moore Marsha E
Home Financials for this Owner
Home Financials are based on the most recent Mortgage that was taken out on this home.
Original Mortgage
$111,155
Interest Rate
7.82%
Mortgage Type
FHA
Create a Home Valuation Report for This Property
The Home Valuation Report is an in-depth analysis detailing your home's value as well as a comparison with similar homes in the area
Home Values in the Area
Average Home Value in this Area
Purchase History
| Date | Buyer | Sale Price | Title Company |
|---|---|---|---|
| Alvarez Jose R | -- | First American Title Company | |
| Alvarez Jose R | $108,200 | First American Title Company | |
| Hud | $68,568 | Stewart Title | |
| Taheebo Enterprises Inc | $122,385 | -- | |
| Moore Bobby K | $112,000 | Land Title |
Source: Public Records
Mortgage History
| Date | Status | Borrower | Loan Amount |
|---|---|---|---|
| Open | Alvarez Jose R | $104,954 | |
| Previous Owner | Moore Bobby K | $111,155 |
Source: Public Records
Tax History Compared to Growth
Tax History
| Year | Tax Paid | Tax Assessment Tax Assessment Total Assessment is a certain percentage of the fair market value that is determined by local assessors to be the total taxable value of land and additions on the property. | Land | Improvement |
|---|---|---|---|---|
| 2025 | $1,008 | $79,636 | $25,900 | $53,736 |
| 2024 | $979 | $79,636 | $25,900 | $53,736 |
| 2023 | $979 | $78,987 | $28,000 | $50,987 |
| 2022 | $1,042 | $69,265 | $22,750 | $46,515 |
| 2021 | $965 | $65,315 | $21,000 | $44,315 |
| 2020 | $893 | $63,965 | $19,950 | $44,015 |
| 2019 | $837 | $58,915 | $15,400 | $43,515 |
| 2018 | $799 | $53,658 | $11,900 | $41,758 |
| 2017 | $1,547 | $52,747 | $10,500 | $42,247 |
| 2016 | $749 | $50,849 | $8,400 | $42,449 |
| 2015 | $747 | $34,560 | $5,600 | $28,960 |
| 2014 | $723 | $23,924 | $3,850 | $20,074 |
Source: Public Records
Map
Nearby Homes
- 3711 Lone Oak St
- 3630 Three Bars Ct
- 3915 Eblick Wash Dr
- 3540 Purdue
- 3711 Southern Light Dr
- 3975 Eblick Wash Dr
- 3923 Via Lucia Dr
- 3829 Northern Light Dr
- 4052 Rocky Beach Dr
- 4064 Rocky Beach Dr
- 3726 Glow Dr
- 3747 Gulliver St
- 3501 Orvis St
- 3508 Rio Robles Dr Unit D
- 3508 Rio Robles Dr Unit C
- 3508 Rio Robles Dr Unit A
- 4199 Dobson Dr
- 3401 N Walnut Rd Unit 330
- 3401 N Walnut Rd Unit 121
- 3401 N Walnut Rd Unit 113
- 3838 Gold Mist Ave
- 3842 Gold Mist Ave
- 3778 Melbourne Cir
- 3839 Idlewood Ave
- 3788 Melbourne Cir
- 3836 Gold Mist Ave
- 3844 Gold Mist Ave
- 3841 Idlewood Ave
- 3742 Mendacino St
- 3779 Melbourne Cir
- 3843 Idlewood Ave
- 3834 Gold Mist Ave
- 3732 Mendacino St
- 3731 Mendacino St
- 3743 Rochester Ave
- 3789 Melbourne Cir
- 3845 Idlewood Ave
- 3733 Rochester Ave
- 3799 Melbourne Cir