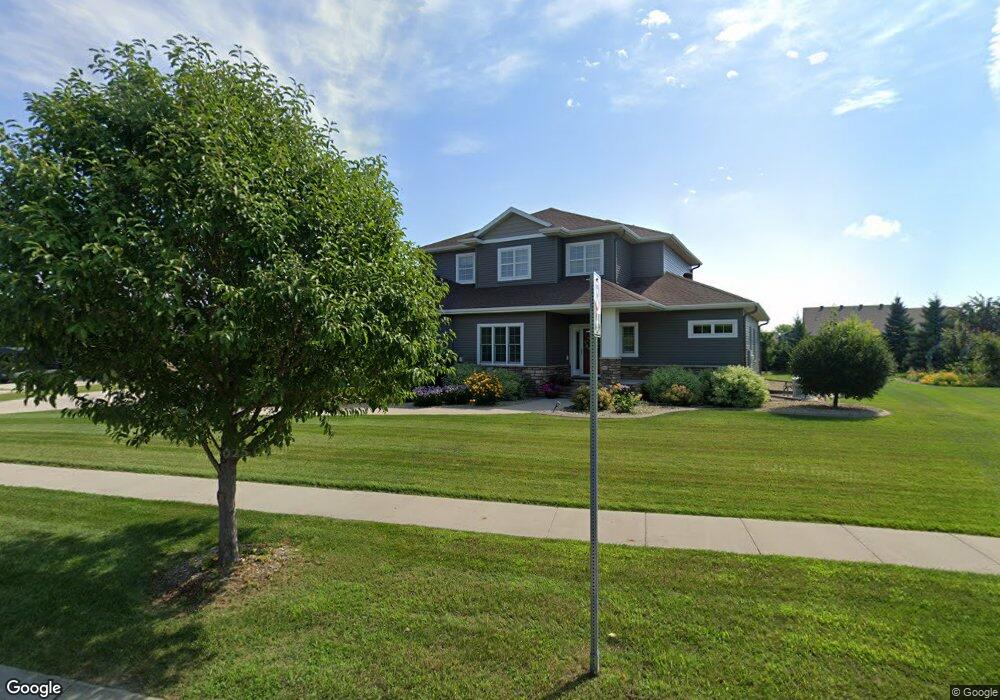
3841 2nd St E West Fargo, ND 58078
Osgood NeighborhoodEstimated Value: $728,000
5
Beds
3
Baths
2,955
Sq Ft
$246/Sq Ft
Est. Value
About This Home
This home is located at 3841 2nd St E, West Fargo, ND 58078 and is currently estimated at $728,000, approximately $246 per square foot. 3841 2nd St E is a home with nearby schools including Aurora Elementary School, Liberty Middle School, and West Fargo Sheyenne High School.
Ownership History
Date
Name
Owned For
Owner Type
Purchase Details
Closed on
Jun 29, 2012
Sold by
Osgood Investments Llc
Bought by
Bechmeier Custom Homes Inc
Current Estimated Value
Purchase Details
Closed on
Dec 7, 2010
Sold by
Osgood Investments Llc
Bought by
Plecity Kowalski Construction Inc
Create a Home Valuation Report for This Property
The Home Valuation Report is an in-depth analysis detailing your home's value as well as a comparison with similar homes in the area
Home Values in the Area
Average Home Value in this Area
Purchase History
| Date | Buyer | Sale Price | Title Company |
|---|---|---|---|
| Bechmeier Custom Homes Inc | -- | None Available | |
| Plecity Kowalski Construction Inc | -- | -- |
Source: Public Records
Tax History
| Year | Tax Paid | Tax Assessment Tax Assessment Total Assessment is a certain percentage of the fair market value that is determined by local assessors to be the total taxable value of land and additions on the property. | Land | Improvement |
|---|---|---|---|---|
| 2024 | $11,413 | $389,950 | $63,800 | $326,150 |
| 2023 | $13,625 | $366,300 | $63,800 | $302,500 |
| 2022 | $13,499 | $340,550 | $63,800 | $276,750 |
| 2021 | $13,268 | $320,050 | $57,400 | $262,650 |
| 2020 | $13,188 | $318,500 | $57,400 | $261,100 |
| 2019 | $13,691 | $328,650 | $57,400 | $271,250 |
| 2018 | $13,712 | $334,200 | $57,400 | $276,800 |
| 2017 | $13,574 | $334,350 | $57,400 | $276,950 |
| 2016 | $12,669 | $334,300 | $57,400 | $276,900 |
| 2015 | $12,198 | $298,950 | $44,350 | $254,600 |
| 2014 | $9,964 | $275,350 | $44,350 | $231,000 |
| 2013 | $9,919 | $192,500 | $44,350 | $148,150 |
Source: Public Records
Map
Nearby Homes
- 3878 3rd St E
- 3755 Houkom Dr E
- 6511 Osgood Pkwy S
- 414 Westview Ln E
- 3702 Houkom Dr E
- 522 Westview Ln E
- 3605 Houkom Dr E
- 3784 Bell Blvd E
- 3644 6th St E
- 229 36 1 2 Avenue Place E
- 4337 66th St S
- 4355 66th St S
- 3463 Loberg Dr
- 3479 Loberg Ln
- 528 Prescott Ln
- 267 34th Ave E
- 6976 65th St S
- 7108 65th St S
- 7018 65th St S
- 6965 65th St S
Your Personal Tour Guide
Ask me questions while you tour the home.