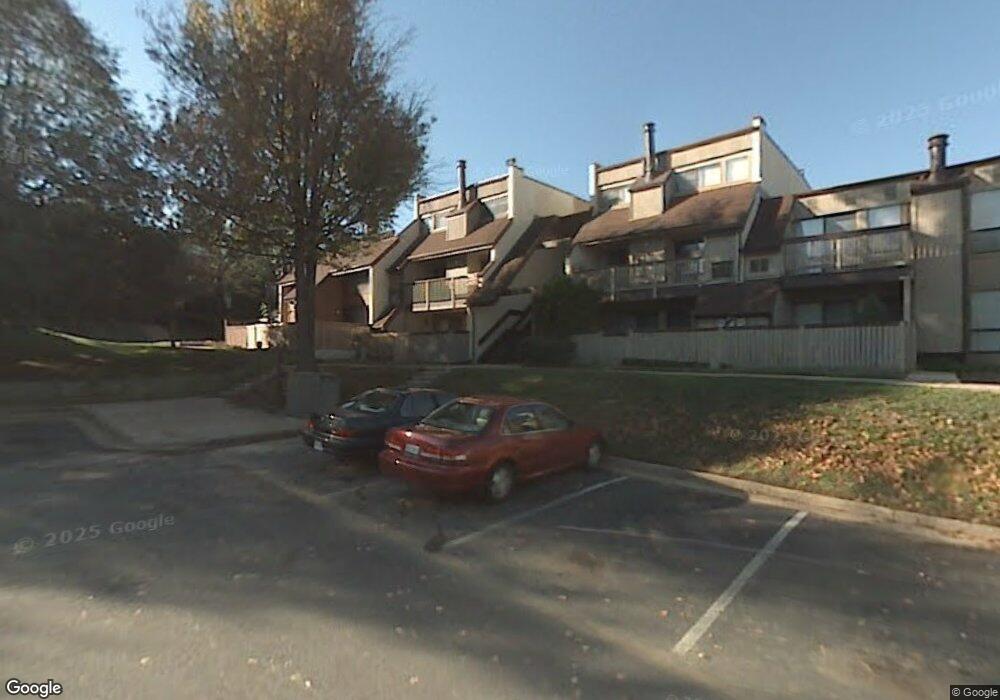
3843 El Camino Place Alexandria, VA 22309
Woodlawn NeighborhoodEstimated Value: $286,357 - $305,000
2
Beds
2
Baths
1,058
Sq Ft
$279/Sq Ft
Est. Value
About This Home
This home is located at 3843 El Camino Place, Alexandria, VA 22309 and is currently estimated at $295,339, approximately $279 per square foot. 3843 El Camino Place is a home located in Fairfax County with nearby schools including Mount Vernon Woods Elementary School, Whitman Middle School, and Mount Vernon High.
Ownership History
Date
Name
Owned For
Owner Type
Purchase Details
Closed on
Feb 15, 2024
Sold by
Hollo Management Llc
Bought by
Bishop Daniel C
Current Estimated Value
Home Financials for this Owner
Home Financials are based on the most recent Mortgage that was taken out on this home.
Original Mortgage
$271,000
Outstanding Balance
$266,220
Interest Rate
6.62%
Mortgage Type
FHA
Estimated Equity
$29,119
Purchase Details
Closed on
Oct 12, 2010
Sold by
Federal National Mortgage Association
Bought by
Hollo Management Llc
Purchase Details
Closed on
Feb 19, 2010
Sold by
Samuel I White Pc Sub Tr
Bought by
Federal National Mortgage Association
Purchase Details
Closed on
Jun 28, 2001
Sold by
Richardson Rosa L
Bought by
Son Tina T
Home Financials for this Owner
Home Financials are based on the most recent Mortgage that was taken out on this home.
Original Mortgage
$71,780
Interest Rate
7.14%
Mortgage Type
Purchase Money Mortgage
Create a Home Valuation Report for This Property
The Home Valuation Report is an in-depth analysis detailing your home's value as well as a comparison with similar homes in the area
Home Values in the Area
Average Home Value in this Area
Purchase History
| Date | Buyer | Sale Price | Title Company |
|---|---|---|---|
| Bishop Daniel C | $276,000 | Old Republic National Title | |
| Hollo Management Llc | $90,000 | -- | |
| Federal National Mortgage Association | $104,486 | -- | |
| Son Tina T | $74,000 | -- |
Source: Public Records
Mortgage History
| Date | Status | Borrower | Loan Amount |
|---|---|---|---|
| Open | Bishop Daniel C | $271,000 | |
| Previous Owner | Son Tina T | $71,780 |
Source: Public Records
Tax History Compared to Growth
Tax History
| Year | Tax Paid | Tax Assessment Tax Assessment Total Assessment is a certain percentage of the fair market value that is determined by local assessors to be the total taxable value of land and additions on the property. | Land | Improvement |
|---|---|---|---|---|
| 2025 | $2,757 | $272,360 | $54,000 | $218,360 |
| 2024 | $2,757 | $237,970 | $48,000 | $189,970 |
| 2023 | $2,464 | $218,320 | $44,000 | $174,320 |
| 2022 | $2,290 | $200,290 | $40,000 | $160,290 |
| 2021 | $2,176 | $185,450 | $37,000 | $148,450 |
| 2020 | $2,071 | $174,950 | $35,000 | $139,950 |
| 2019 | $1,891 | $159,770 | $32,000 | $127,770 |
| 2018 | $1,783 | $155,050 | $31,000 | $124,050 |
| 2017 | $1,747 | $150,440 | $30,000 | $120,440 |
| 2016 | $1,743 | $150,440 | $30,000 | $120,440 |
| 2015 | $1,616 | $144,810 | $29,000 | $115,810 |
| 2014 | $1,536 | $137,910 | $28,000 | $109,910 |
Source: Public Records
Map
Nearby Homes
- 3827 El Camino Place Unit 13
- 3804 El Cerrito Place Unit 4E
- 7947 Sausalito Place Unit 25C
- 3916 Woodhue Place Unit 8
- 3878 Havenwood Place Unit 75D
- 7984 Audubon Ave Unit 203
- 7911 Martha Washington St
- 4111 Lawrence St
- 3744 Shannons Green Way
- 3775 Shannons Green Way
- 3823 Monte Vista Place Unit 97D
- 8101 Richmond Hwy
- 8298 Jake Place
- 3416 Sunny View Dr
- 7926 Russell Rd
- 4207 Corcoran St
- 7927 Ashboro Dr
- 4300 Fielding St
- 8180 Fernlake Ct
- 4314 Gramercy Cir
- 3813 El Camino Place Unit 28
- 3827 El Camino Place
- 3801 El Camino Place Unit 29
- 3823 El Camino Place Unit 17
- 3855 El Camino Place Unit 6
- 3839 El Camino Place Unit 14
- 3813 El Camino Place
- 3843 El Camino Place Unit 3843
- 3811 El Camino Place
- 3805 El Camino Place Unit 25
- 3809 El Camino Place
- 3843 El Camino Place Unit 7
- 3815 El Camino Place Unit 26
- 3849 El Camino Place Unit 3
- 3845 El Camino Place Unit 9
- 3837 El Camino Place Unit 16
- 3807 El Camino Place Unit 23
- 3855 El Camino Place
- 3851 El Camino Place
- 3849 El Camino Place